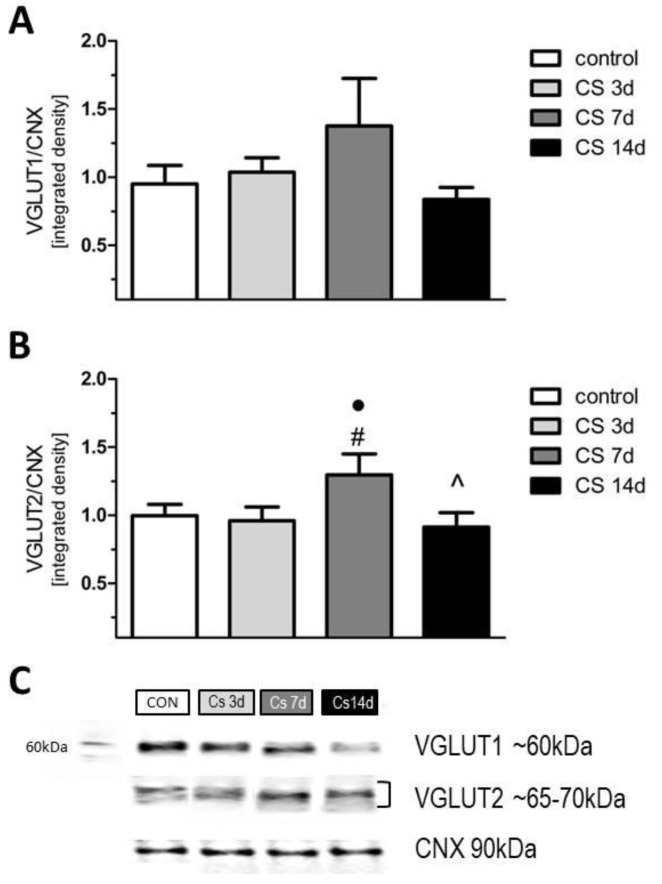
Figure 8.
The influence of crowding stress and its duration on the expression of glutamate transporters in the rat FC. Expression of VGLUT1 (A), VGLUT2 (B). (C) Representative immunoblots that illustrate VGLUTs expression in the FC after crowding stress (CS). Data were calculated as percentages of controls and are expressed as means ± SEM (control: n = 9; CS 3d: n = 5; CS 7d: n = 5; CS 14d: n = 5) ● 1> p > 0.05 vs. control (LSD test); # p < 0.05 vs. SC 3days; ^ p < 0.05 vs. CS-7days, (LSD test).

