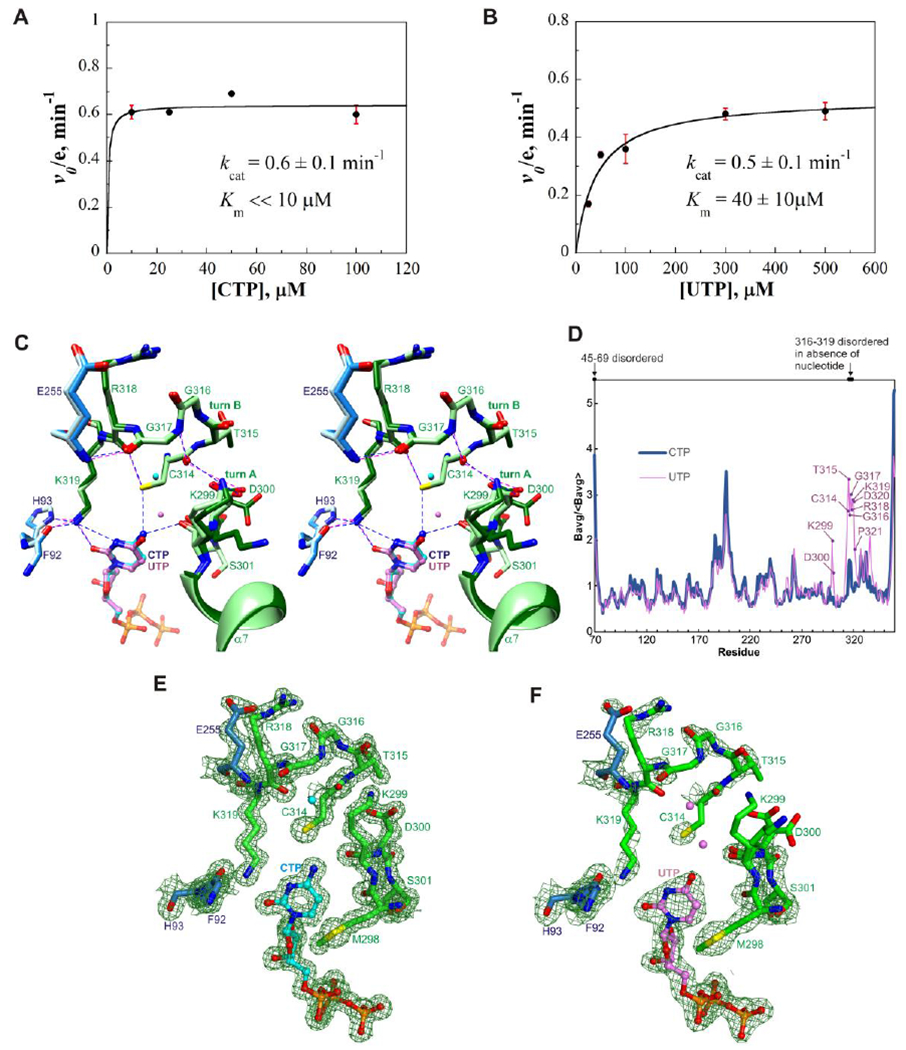
Figure 3. Kinetic studies and structural basis of substrate selectivity.

(A) Plot of initial rate of ddhCTP production versus CTP concentration (with 100 μM SAM). The enzyme was saturated even at the lowest substrate concentration, 10 μM. The kcat is 0.6±0.1 min−1. (B) Plot of initial rate of ddhUTP production versus UTP concentration (with 100 μM SAM). Km for UTP = 40±10 μM. kcat = 0.5±0.1 min−1. Each value is the mean of three replicates ± s.d. (C) Stereoview superimposition of nucleobase binding sites of the CTP and UTP-bound complexes. Core domain residues are colored light blue and dodger blue, and C-terminal extension residues light green and dark green, respectively. CTP and UTP are shown as balls-and-sticks with carbon atoms colored cyan and light purple, respectively; nearby water molecules are shown as spheres and colored similarly. The hydrophobic residues have similar structures in the two complexes and are omitted for clarity. Potential hydrogen bonds and other electrostatic interactions are shown as blue and magenta dashed lines in the CTP and UTP-bound complexes, respectively. (D) Average main chain B-factors for viperin bound to CTP or UTP. The averages are normalized by the average for all residues. Residues in the UTP-bound complex showing significantly higher B-factors relative to the CTP-bound complex are indicated. (E) Electron density of the cytosine binding site. (F) Electron density of the uracil binding site. Panels E and F show composite omit maps computed using PHENIX with default settings and drawn at a contour level of 1.2 times the root mean square value of the map using PyMOL.46
