Figure 2.

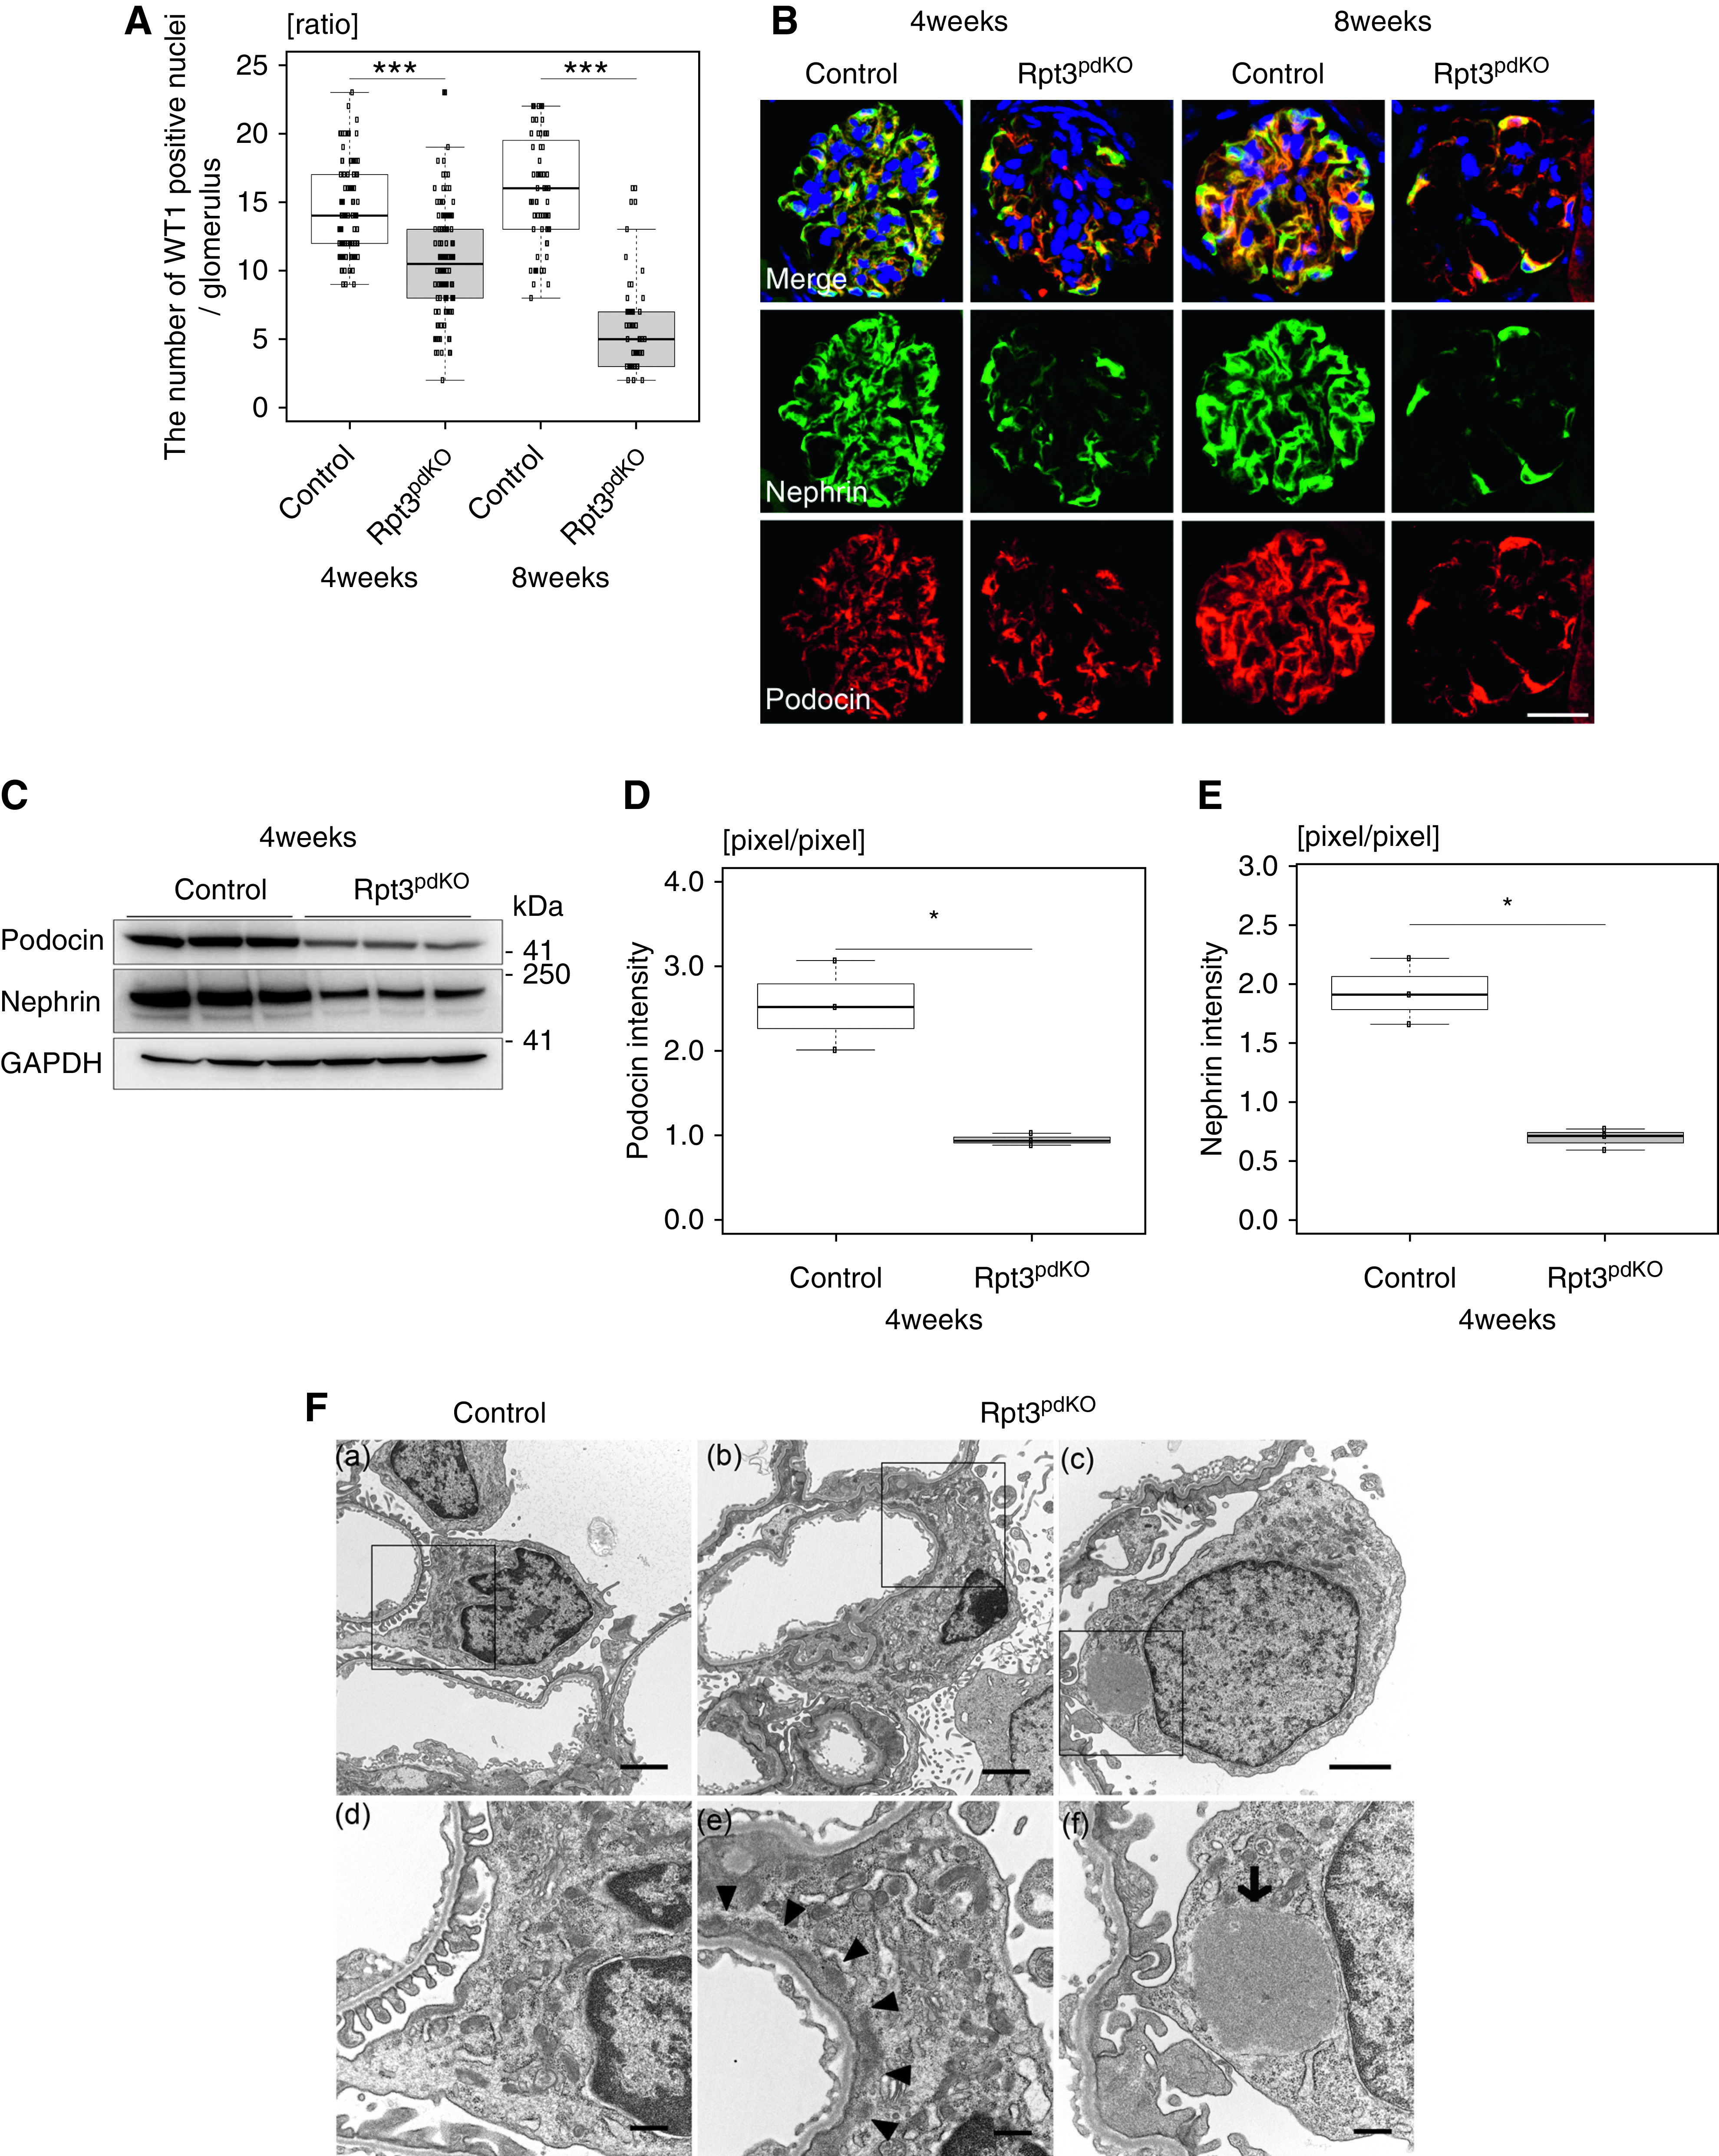
Rpt3pdKO mice showed podocyte injury and loss. (A) The number of WT1-positive cells was significantly decreased in Rpt3pdKO mice at 4 and 8 weeks of age (4 weeks of age: 14.5±0.34 versus 10.7±0.34, P<0.001, Rpt3Control [n=105], Rpt3pdKO [n=120] and 8 weeks of age: 15.9±3.9 versus 5.8±3.2, P<0.001, Rpt3Control [n=64], Rpt3pdKO [n=46], P<0.001 by Mann–Whitney U test). (B) The expressions of podocin and nephrin showed a linear pattern in Rpt3Control kidneys but a cytosolic pattern in Rpt3pdKO kidneys. (C) WB of glomerular lysate showed the expressions of podocin and nephrin decreased in Rpt3pdKO mice compared with Rpt3Control mice at 4 weeks of age. (D and E) The graphs show the densitometry quantification of podocin and nephrin expressions in WB of glomerular lysate (n=3). *P=0.05 by Welch t test; ***P<0.001 by Welch t test. (F, a) Transmission electron microscopy showed podocyte foot processes in Rpt3Control kidneys. (F, b) The podocytes of Rpt3pdKO mice exhibited foot process effacement at 4 weeks of age. (F, c) The podocytes of Rpt3pdKO mice exhibited the formation of intracellular accumulations of uniform density around nuclei at 4 weeks of age. (F, d–f) High-magnification images of the square portions of F, a–c, respectively. (The arrowheads show foot process effacement, and the arrow shows intracellular accumulations of uniform density around nuclei.) Scale bars: 20 μm in B; 2 μm in F, a–c; 500 nm in F, d–f.
