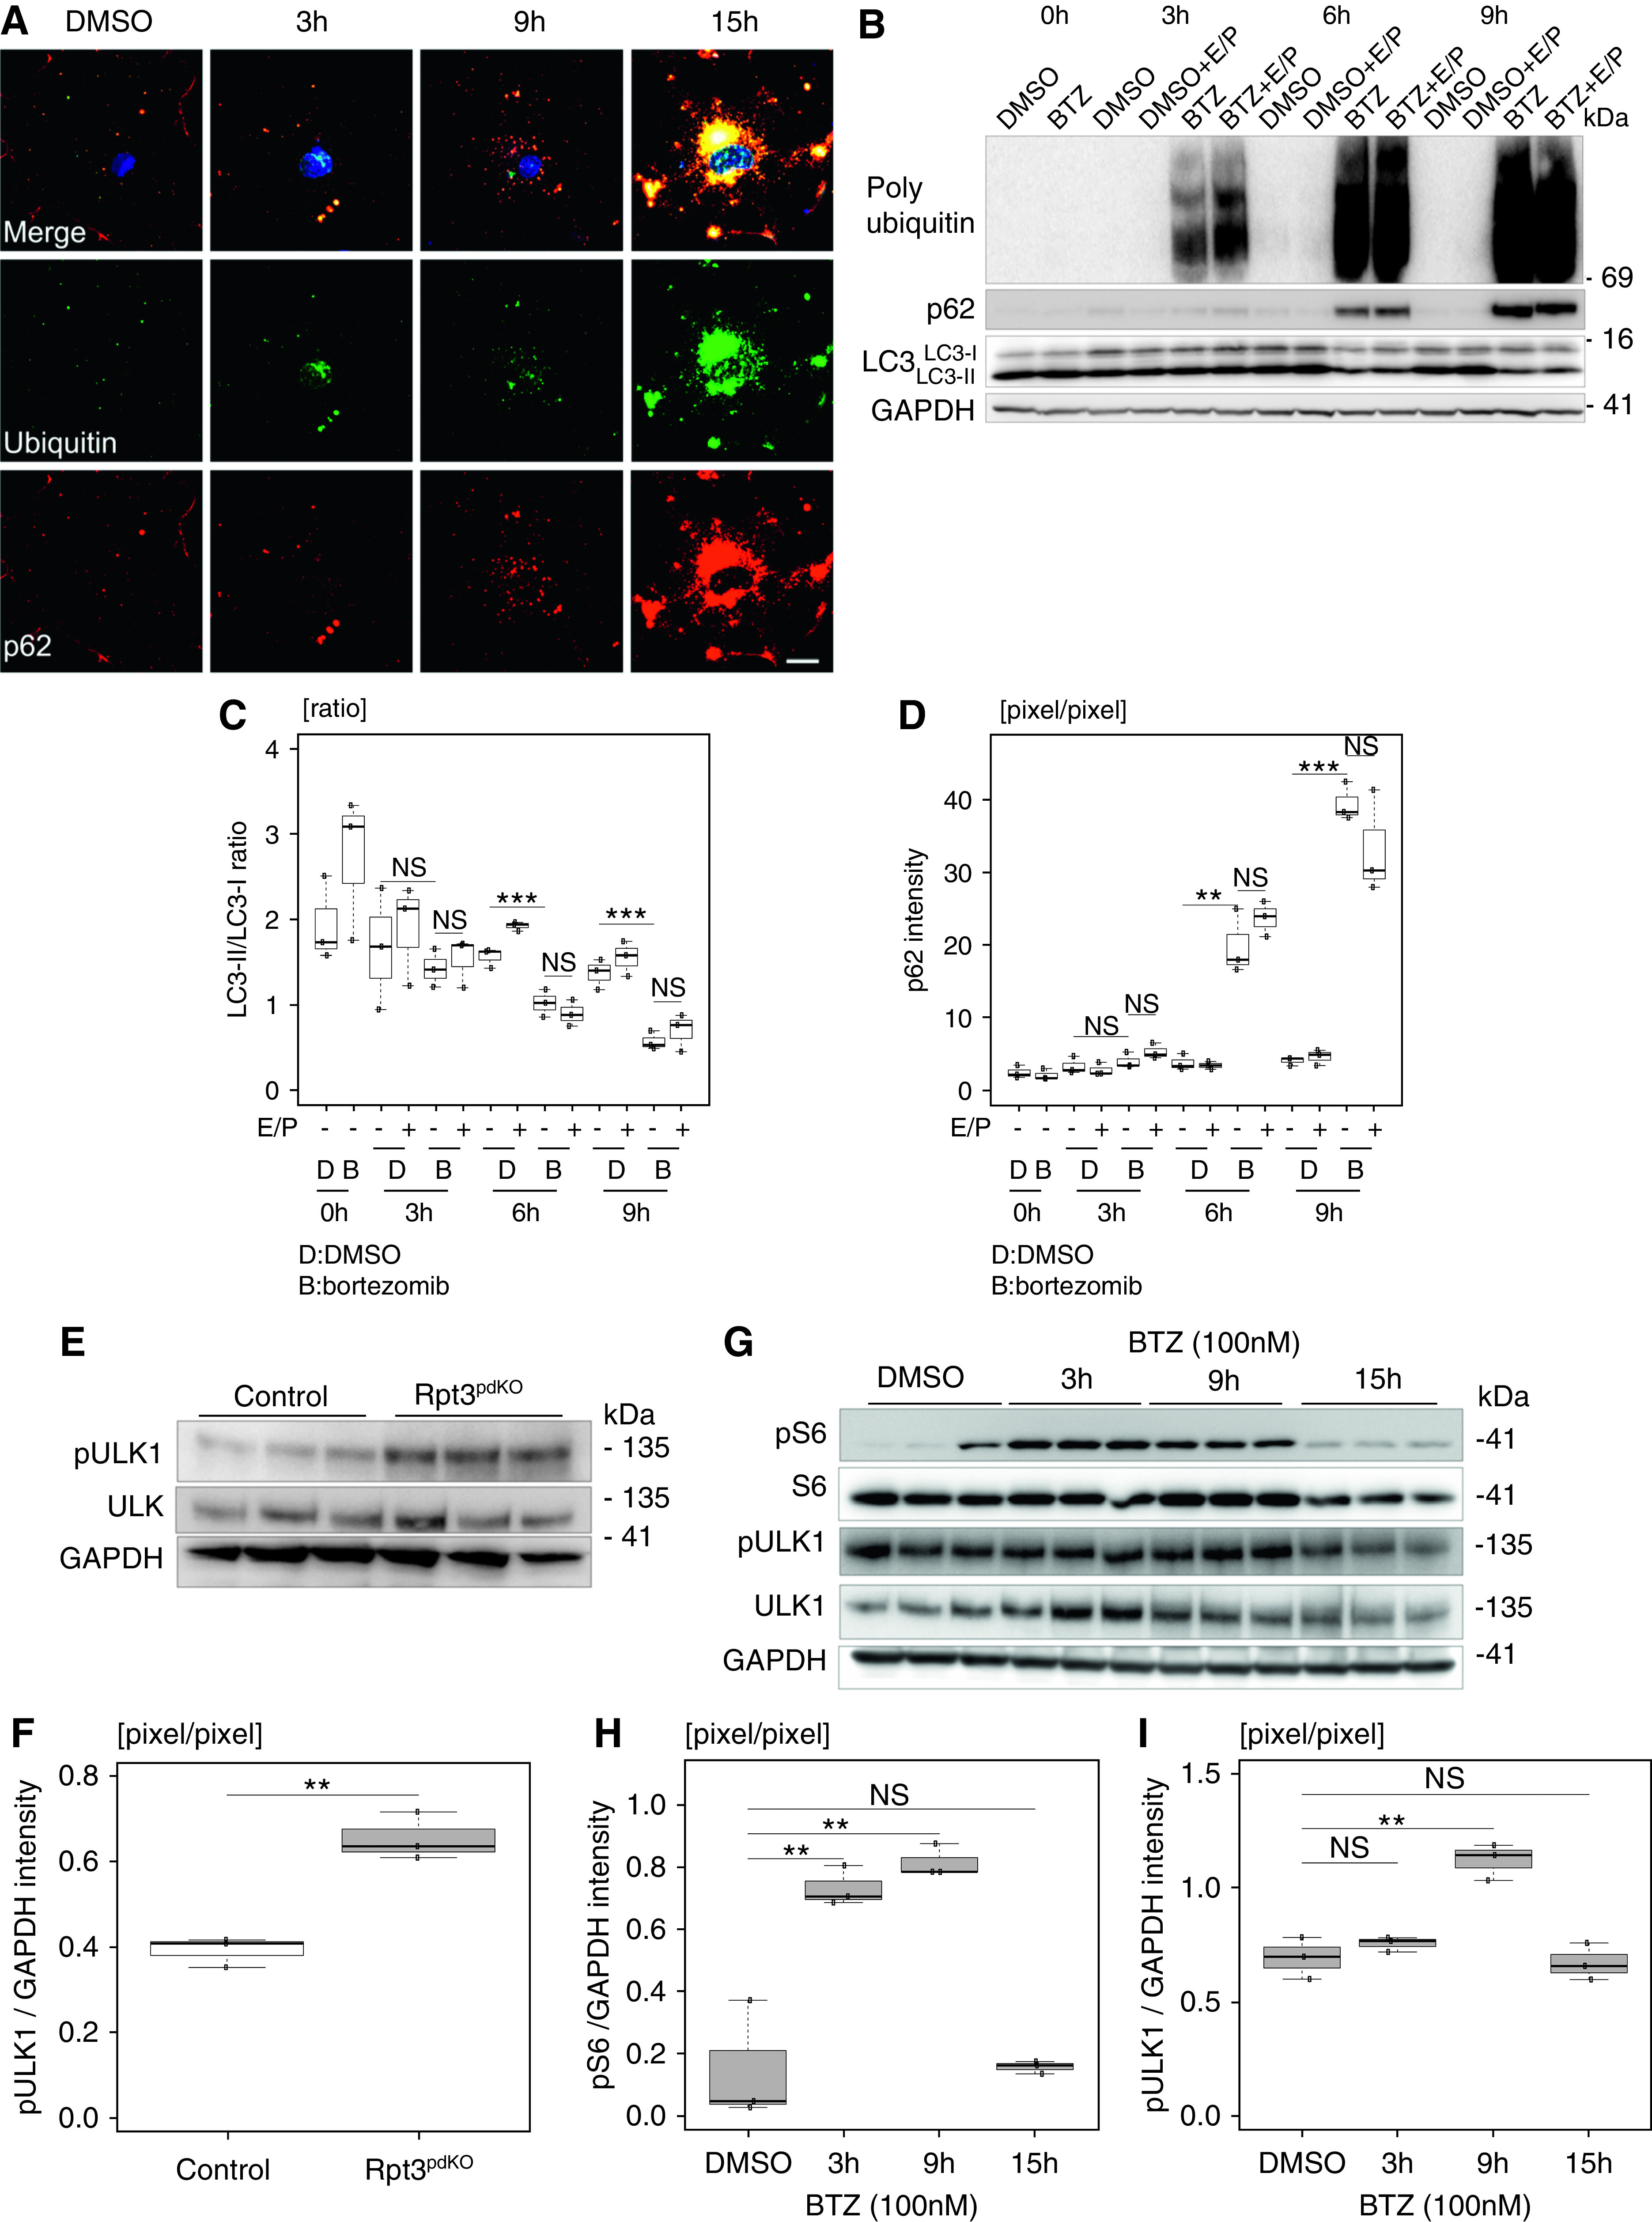
Figure 6.

Proteasome inhibition suppressed autophagic activity mediated by mTOR activation. (A) p62 was accumulated in the cell bodies of cultured podocytes and partially colocalized with ubiquitin at 3 hours after the treatment with bortezomib (BTZ). Scale bar: 20 μm. (B and C) At 6 hours after treatment, the LC3-II–LC3-I ratio was significantly reduced with BTZ treatment compared with DMSO treatment, and the ratio was unchanged with or without the effect of E/P. (B and D) p62 was significantly accumulated with BTZ treatment compared with DMSO treatment, and the accumulation did not change with or without the effect of E/P. (C and D) The densitometry quantification of LC3-II–LC3-I and p62 expression in WB shown in (B) (n=3). (E) The expression of phosphorylated ULK (ser757) that is the mTOR-specific phosphorylation site increased in Rpt3pdKO mice compared with that in Rpt3Control mice. (F) The densitometry quantification of phosphorylated ULK expression normalized with GAPDH in WB shown in (E) (n=3). (G) The expression of phosphorylated S6 significantly increased for 3–9 hours and decreased at 15 hours, and the expression of phosphorylated ULK (ser757) increased at 9 hours and decreased at 15 hours after the treatment of BTZ to cultured podocytes (n=3). (H and I) The densitometry quantification of phosphorylated S6 and phosphorylated ULK (ser757) expression normalized with GAPDH in WB shown in (G) (n=3). BTZ was used at a concentration of 100 nM, and E/P was used at concentrations of 10 and 25 μg/ml, respectively. The conditions of the control group were set at 15 hours of DMSO treatment. **P=0.01 by Welch t test; ***P<0.001 by Welch t test.
