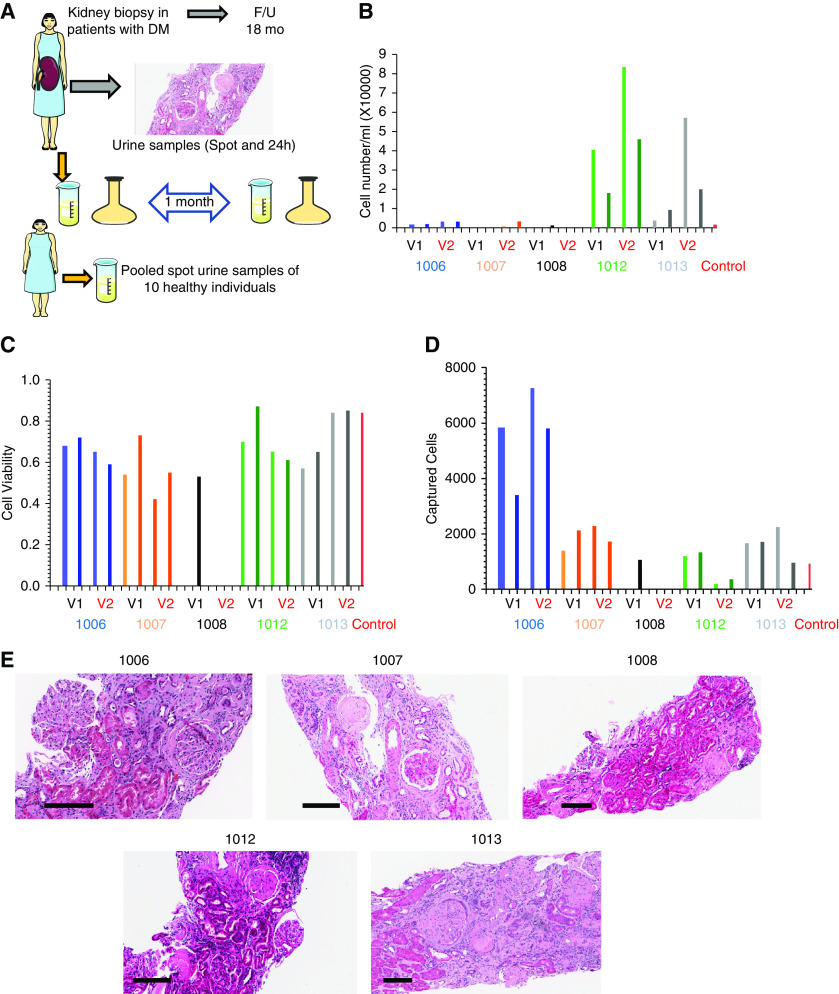
Figure 1.
Study design and urine characteristics. (A) Subjects with diabetes underwent diagnostic kidney biopsy. Tissue samples analyzed and scored by light and electron microscopy and immunofluorescence. Subjects were followed for 18 months. Spot and 24-hour urine samples were collected 1 month apart and analyzed. Ten spot urine samples from ten healthy individuals as control were obtained and pooled for the single-cell RNA-seq study. (B) Sample level, urinary cell number per ml urine (y-axis), x-axis is each patient, collection method, and time. (C) Sample level, urinary cell viability (y-axis), x-axis is each patient, collection method, and time. (D) Total captured cell number per sample, each column represents one sample, lighter and darker shades of the same color represent spot urine sample and the darker color shows the 24-hour urine collection. V1 and V2 represent visit 1 and visit 2, respectively, for each subject. (E) Images of periodic acid–Schiff-stained kidney section of each kidney biopsy. Scale bars are shown at the left bottom of each image represent 200 µm. DM, diabetes mellitus; F/U, follow up.

