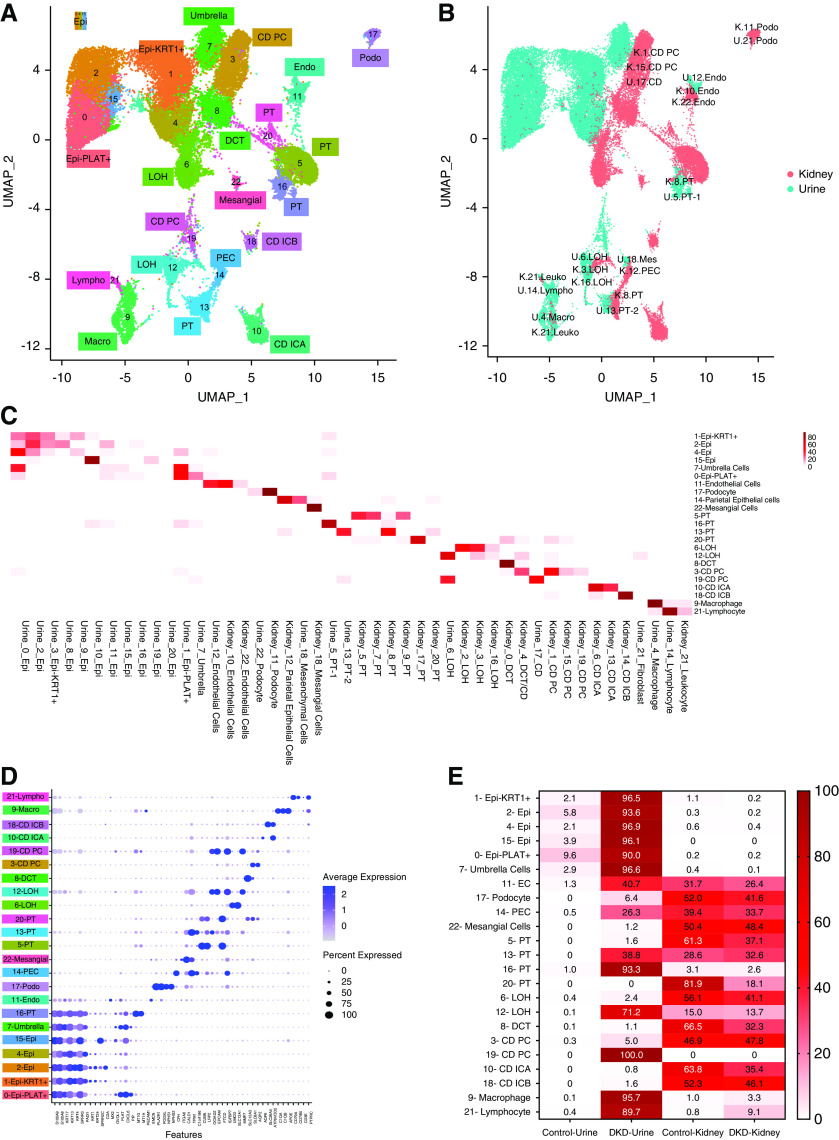
Figure 4.
Integration of urine single cell with human kidney single nuclei datasets. (A) Uniform Manifold Approximation and Projection (UMAP) of Harmony-based integration of urinary and kidney cells. (B) UMAP of Harmony-based integration of urinary and kidney cells colored by the sample of origin. Blue indicates the urine origin and pink shows the cells originated from kidney. Each cluster is labelled with the cells of origin. (C) The percent of cells in each integrated (urine and kidney) cluster (y-axis) that came from each original cluster (x-axis). (D) Bubble dot plots of the top cell-type–specific differentially expressed genes in the integrated clusters of urine and kidney samples. The size of the dot indicates the expression percentage and the darkness of the color indicates average expression. (E) The fraction of cells in each integrated cluster and their sample of origin. The data are colored by the percentage of cell. Epi, variety epithelial cells; Epi-PLAT+, PLAT-positive cells; Epi-KRT1+, KRT1-positive cells; umbrella, umbrella cells; endo, endothelial cells; EC, endothelial cells; LOH, loop of Henle; CD PC, collecting duct principal cells; CD ICA, collecting duct intercalated cells A; CD ICB, collecting duct intercalated cells B; DCT, distal convoluted tubule; mesangial, mesangial cells; podo, podocytes; PEC, parietal epithelial cells; macro, macrophages; lympho, lymphocytes; U, urine; K, kidney; leuko, leukocyte; mes, mesenchymal cells.

