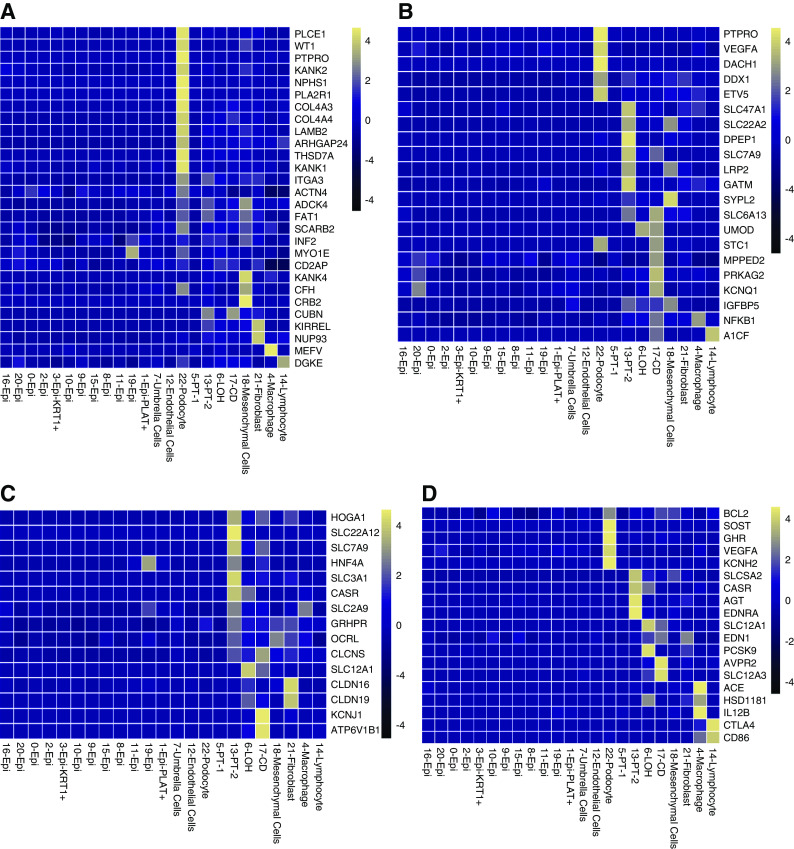
Figure 6.
Urinary single-cell profiling provides a read-out for kidney disease genes and drug targets. (A) Urinary single cell-type specific expression enrichment of monogenic nephrotic syndrome genes. (B) Urinary single cell-type–specific expression enrichment of CKD-GWAS–nominated genes. (C) Urinary single cell-type–specific expression enrichment genes related to nephrolithiasis. (D) Urinary single cell-type–specific expression enrichment of Food and Drug Administration–approved drug target genes. Mean gene expression values were calculated in each cell type cluster. The color scheme of the heatmap is on the basis of z score distribution. In each heatmap, x-axis represents the urinary cell clusters and y-axis shows the genes. Epi, variety epithelial cells; Epi-PLAT+, PLAT-positive cells; Epi-KRT1+, KRT1-positive cells; PT, proximal tubule; LOH, loop of Henle; CD, collecting duct principal cells.

