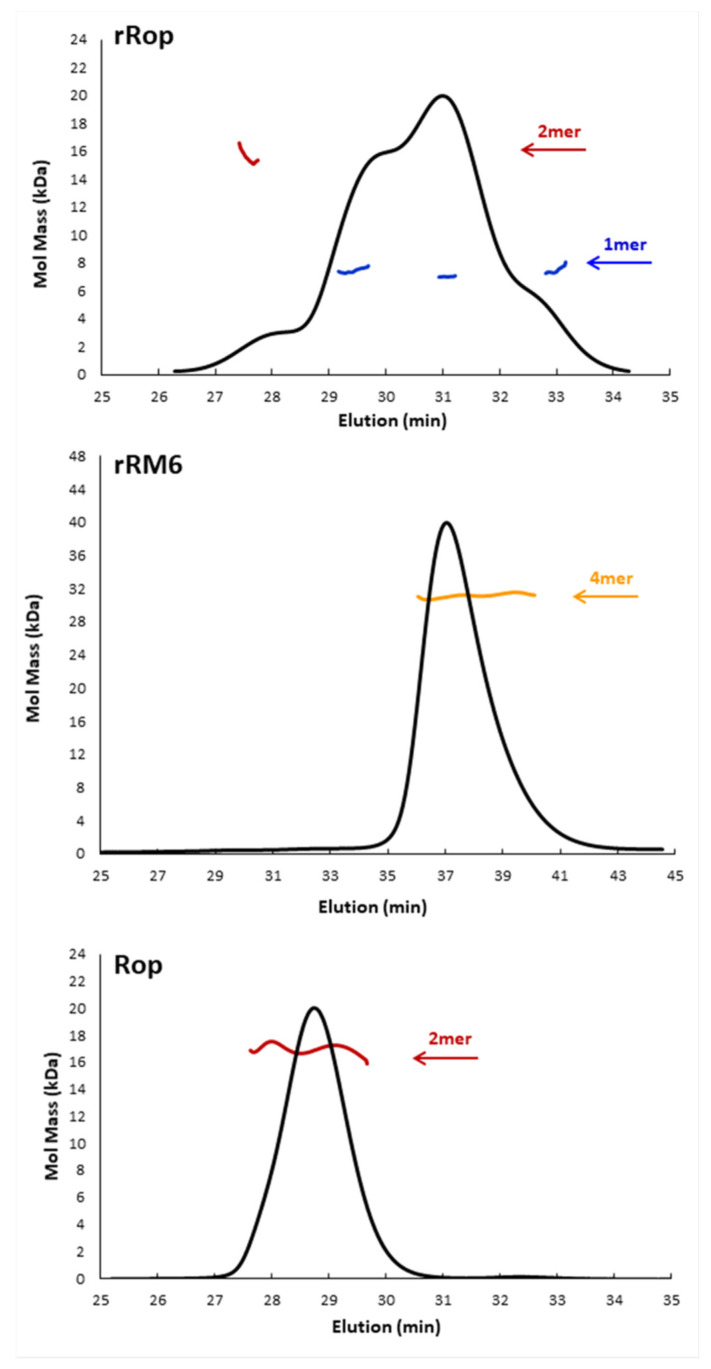
Figure 4.
Molecular mass determined by SEC-Multiangle Laser Light Scattering (MALS) for Rop and the retro proteins rRop and rRM6. Shown are profiles of the three proteins. Colored lines correspond to the averaged molecular mass distributions of the eluting species across the peak as determined by MALS. rRop: Blue and red lines correspond to molecular masses of monomers and dimers, respectively. The protein was purified with the non-refolding conditions. rRM6: The yellow line corresponds to a tetramer. Rop: The red line corresponds to the molecular mass of a dimer.

