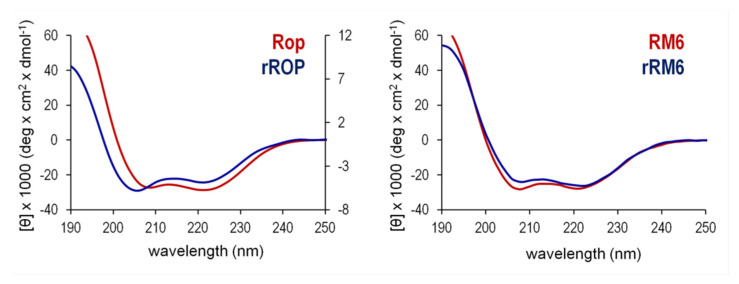
Figure 5.
Comparison of the far-UV CD spectra of Rop and RM6 recorded at 20 °C, with those of their retro counterparts. On the left panel, the spectra of Rop and rRop are drawn on a different scale, with the mean residual ellipticity (MRE) values on the left vertical axis corresponding to the CD spectrum of Rop, and the value on the right axis to the CD spectrum of rRop, which was purified using the refolding protocol.

