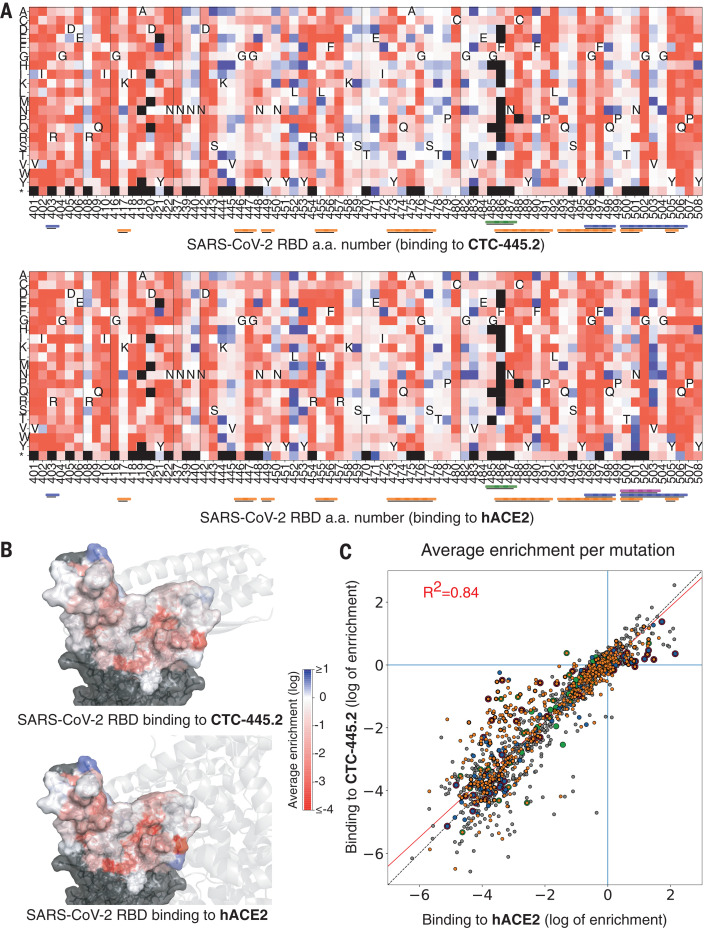
Fig. 4. Resilience of CTC-445.2 to SARS-CoV-2 RBD mutational escape.
(A) Deep mutational scanning (DMS) of the SARS-CoV-2 RBD interface was performed to assess the effect on binding (by yeast display) to CTC-445.2 (top) or hACE2 (bottom) at eight different concentrations (656, 218, 72, 24, 8, 2, 0.3, and 0.1 nM; fig. S16 and materials and methods). The heatmaps indicate the effect on binding for each possible single amino acid mutation in the hACE2-binding interface of the RBD (see the materials and methods). The results are the average over all the concentrations tested. A black square represents lack of expression in the naive (unselected) library. The color bars at the bottom indicate the secondary structure element with which a given RBD residue interacts: H1, orange; H2, green; EE3, blue; and H4, magenta. Approximately 1700 single mutations were targeted by the experiment. (B) The SARS-CoV-2 RBD surface is colored according to the per-residue-averaged enrichments for binding to CTC-445.2 (top) or hACE2 (bottom). For reference, the structure of CTC-445.2 or ACE2 (respectively) is shown in semitransparent gray cartoons. (C) The 2D scatter plots compare the enrichment values [as in (A)] for the DMS of the RBD binding to CTC-445.2 (y-axis) versus hACE2 (x-axis). There is a high correlation between the effect of RBD mutations in the binding of both molecules, demonstrating the mutational resilience of the de novo decoy (Pearson’s r = 0.92).

