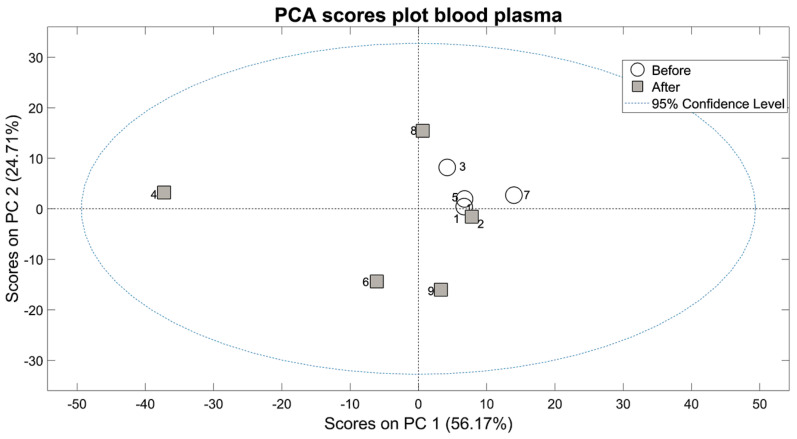
Figure 2.
Scores plot for the PCA of NMR spectra of blood plasma. PC1 and PC2 account together for 81% of the total variance of the metabolic profiles of all samples. Each point in the plot represents the global metabolic profile of one sample. Proximity in the PCA scores plot bidimensional space represents similarity in the global metabolic profile. Samples before (white circles) and after (gray squares) wine intervention show clear separation.

