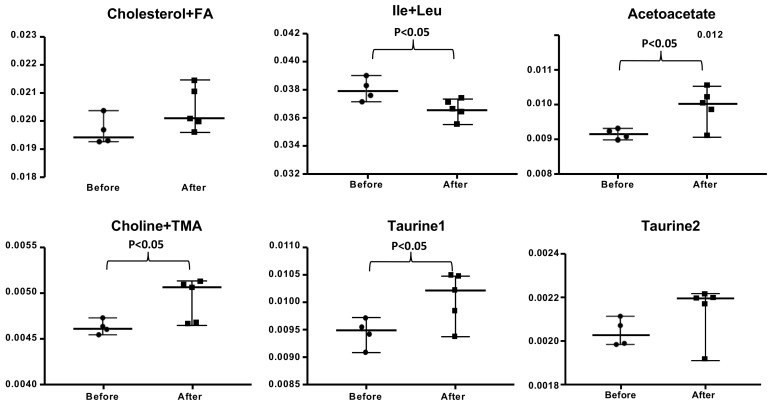
Figure 3.
Metabolic relative content (mean relative spectral intensity) for spectral regions enriched in fatty acids (FA) and cholesterol, isoleucine and leucine, acetoacetate, choline and trimethylamine, and taurine. Data are expressed as median and range with 95% CI. The statistical significance is expressed as p < 0.05.

