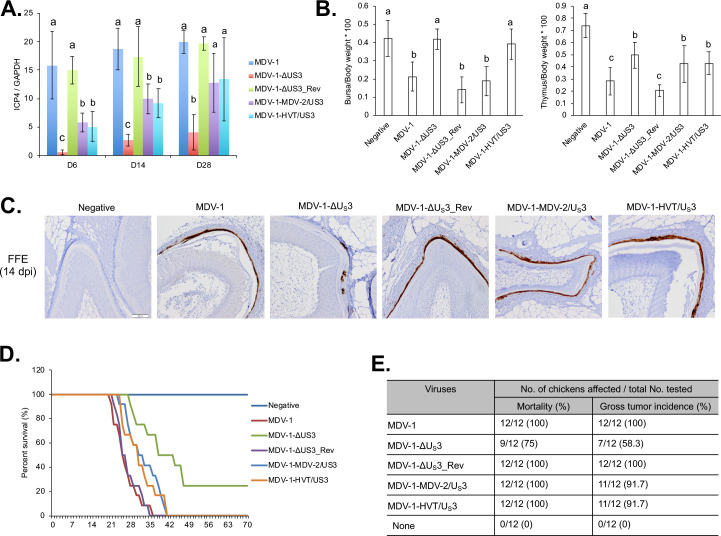
Fig 2. In vivo characterization of chimeric and revertant MDVs.
(A) On 6, 14, and 28 days post inoculation (dpi), splenocytes isolated from 5 chickens infected with the indicated viruses were used for genomic DNA extraction. MDV genomic copy number was determined by qPCR. The relative MDV genomic copy number is presented as the average ratio of ICP4 to GAPDH copy number with error bar representing the standard deviation. Significant difference between groups are marked as letters where different letters represent significant different at p<0.05. (B) On day 14 post inoculation, bursa, thymus, and body weights of 5 chickens infected with the indicated viruses or 5 negative control chickens were measured, and presented as ratio of bursa to body weight (left) and ratio of thymus to body weight (right). The graph represents the average ratio of 5 chickens with error bars showing the standard deviation. Significant difference between groups are marked as letters where different letters represent significant different at p<0.05. (C) At 14 dpi, feather follicle collected from 5 inoculated or negative control chickens were subjected to immunohistochemistry analysis using MDV pp38 antibody. Representative images were presented and scale bar = 100 μm. (D, E) After inoculating with the indicated viruses, chickens were maintained in isolation. The mortality of each group was recorded daily for 10 weeks and percent survival of chickens over time presented in the graph (D). Chickens that died during the experiment were examined for gross MDV specific tumors. The mortality rate and tumor incidence of each group are summarized (E).

