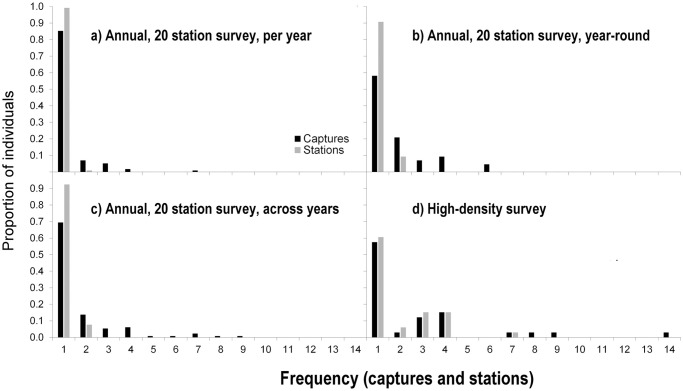
Fig 6. Variation in number of individuals and (spatial) detections across various survey types in the Cockscomb Basin Wildlife Sanctuary, Belize.
The proportion of margay individuals detected with 1, 2, 3, …15 captures (black bars), and proportion of margay individuals detected at 1, 2, 3 …x stations (spatial recaptures, grey bars) for surveys differing in temporal and spatial effort: a) 12 annually repeated dry season 20-station surveys (2–3 months/survey) assessing detections per year (N = 115 individuals, mean distance between neighbouring stations = 2.0 km, mean trap effort ±SD = 2,195 ± 507 trap-nights/survey); b) Continuous year-round (2013–2014) 20-station survey (N = 43 individuals, mean distance between neighbouring stations = 2.0 km, trap effort = 9,262 trap-nights); c) 12 annually repeated 20-station surveys assessing detections across years (N = 131 individuals, mean distance between neighbouring stations = 2.0 km, total effort = 31,208 trap-nights); d) Continuous year-round (2016–2017) high-density survey (N = 33 individuals, mean distance between neighbouring stations = 0.14 km, trap effort = 11,486 trap-nights).

