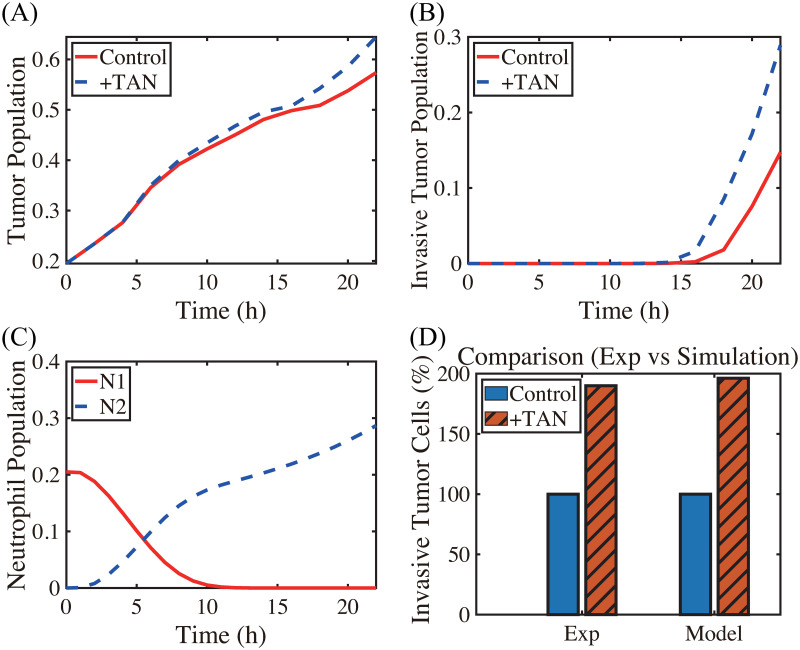
Fig 4. TAN-promoted cancer cell invasion (Experiment [22] & simulation).
(A-B) Time courses of populations of total tumor cells (A) and invasive tumor cells (B). (C) Time courses of N1 (red solid) and N2 (blue dashed) neutrophils. (D) Experimental data from the invasion assay in [22] (left column; 4T1 cancer cells) and computational results from mathematical model (right column). The graph shows the (scaled) populations of invasive tumor cells at t = 22 h in the absence (control) or presence (+TAN) of neutrophils. Here and hereafter cell populations are derived from the continuum density.

