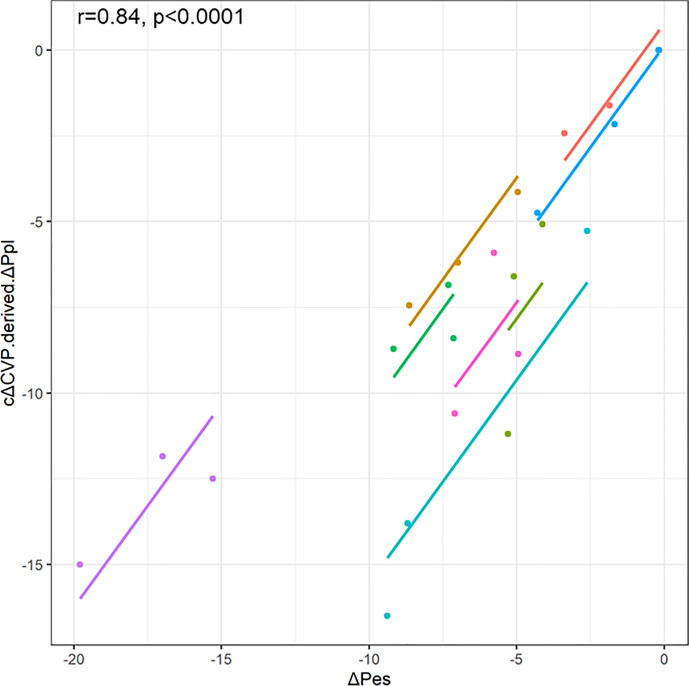
Fig 2. Scatter plots for the repeated measures correlations between cΔCVP-derived ΔPpl and ΔPes.
For comparison, individual data are colored differently. The dots represent the data for each patient, and the corresponding lines represent the linear relationships for each patient. ΔCVP, change in central venous pressure; ΔPpl, change in pleural pressure; ΔPes, change in esophageal pressure; cΔCVP-derived ΔPpl, ΔPpl calculated using a corrected ΔCVP.

