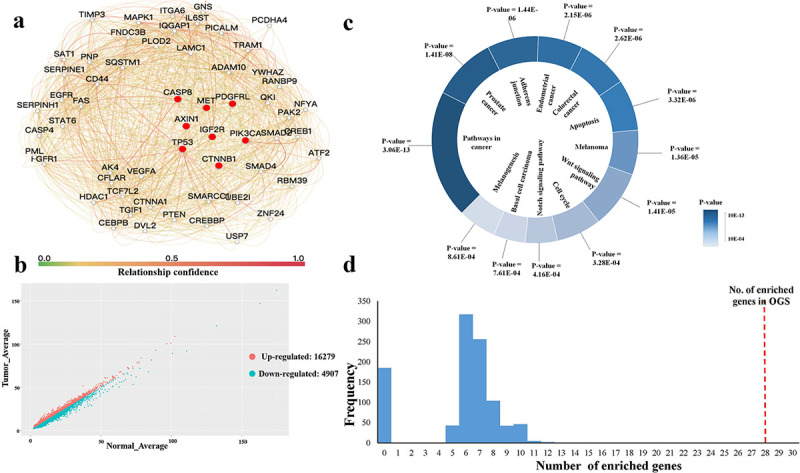
Fig 1. The HCC-specific subnetwork.

(a) The subnetwork is extracted from the liver PPI network, which includes 57 genes and 838 edges. The genes related to HCC obtained from OMIM are marked by a red circle. (b) The distribution of up- and downregulated genes related to HCC. (c) Twelve HCC-specific pathways with lower p-values. The p-values represents the number of HCC-specific genes enriched in the corresponding KEGG pathway. (d) The significance of the OGS of HCC is verified by comparing them with 1,000 random gene sets. The x-axis represents the number of genes involved in 12 HCC-specific KEGG pathways for a random gene set. The y-axis represents the frequency of the 10,000 random gene sets with the corresponding number of enriched genes. The red-dotted line in the right represents the 28 genes in the original gene set enriched in 12 HCC-specific KEGG pathways. OGS: Original Gene Set.
