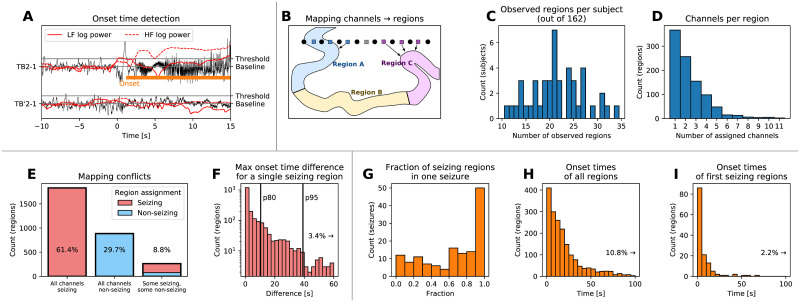
Fig 3. Onset time detection and mapping to brain regions.
(A) Example of the onset time detection. The onset time on a bipolar SEEG channel is detected by computing the power in lower and high frequencies, normalizing it to preictal levels, and detecting when the power increases above a given threshold. This results in marking a channel as seizing (with detected onset time, upper trace) or non-seizing (lower trace). (B) Channels are assigned to brain regions based on their physical distance. If multiple channels are assigned to the same region, the seizing or non-seizing status is determined based on the majority of channels. If the region is seizing, the region onset time is defined as the median of all assigned onset times, taking the non-seizing regions into account as well with onset time equal to infinity. (C) Histogram of observed regions among all patients in the study. (D) Histogram of assigned SEEG channels per observed region. (E) Histogram of regions based on the seizing state of the assigned channels, indicating where the channel to region mapping leads to a conflict in the region seizing state. Ideally, there would be no regions with some seizing and some non-seizing assigned channels. (F) Histogram of differences between the earliest and latest onset time of assigned channels. Vertical lines indicate the 80th and 95th percentile. (G-H) Results of the detection and mapping. (G) Histogram of the fractions of the seizing regions for all seizures. (H) Difference of the detected onset times of all seizing regions from the clinically marked seizure onset. (I) Difference of the detected onset times of the first seizing region of every seizure from the clinically marked seizure onset.

