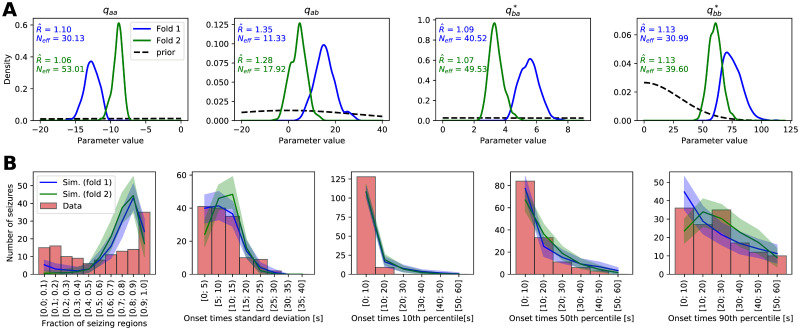
Fig 4. Results of the hyperparameter learning and posterior predictive checks.
(A) Posterior (full lines) and prior (black dashed lines) distributions of the hyperparameters for the models fitted with two data folds. Hyperparameters parameterize the right-hand side function fq of the dynamical model of seizure propagation (1). The text shows the split-chain scale reduction factor and number of effective samples Neff. Note the different x and y ranges of the panels. (B) Results of the posterior predictive checks with the fitted models. In all panels, the red histogram shows the properties of the real seizure ensemble, while the solid lines show the mean of the hundred ensembles of simulated seizures and the shaded areas indicate the 5 to 95 percentile range. The panels show, left to right, distribution of the fraction of the seizing regions in one seizure, standard deviation of the onset times of seizing regions, and 10th, 50th, and 90th percentile of the onset times of seizing regions.

