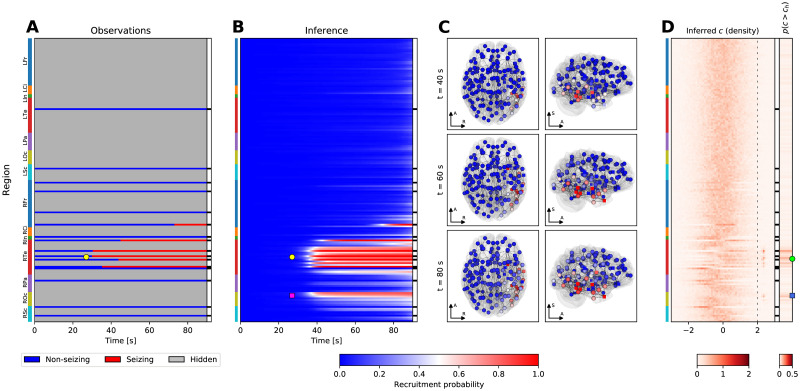
Fig 5. Example of the inference results on a seizure from subject 33.
(A) Observation of the seizure. On vertical axis are the brain regions with color bars on the left indicating the anatomical grouping (abbreviations as in Fig 2). On the horizontal axis is the time; the onset time of the first observed seizing region is always aligned to t = 30s. The black and white column on the right shows which regions were observed. (B) Results of the inference. The partial observations from panel A are completed by the inference; the plot shows the recruitment probability ri(t) = p(ti ≤ t), i.e. the posterior probability that a region i is recruited at time t. In the observed regions the inferred probabilities follow closely the observations with some blurring around the onset due to the assumed observation noise. (C) Snapshots of the recruitment probabilities at three time points. Color code same as in panel B. The spheres and the cubes represent the hidden and observed regions respectively. Only top three percent of the strongest connections are shown for visual clarity, their thickness is proportional to the maximum of the two oriented connection strengths. Axes notation: R, Left-Right axis; A, Posterior-Anterior axis; S, Inferior-Superior axis. (D) Inferred excitability. Left subpanel shows the posterior distributions of the excitabilities, dashed line indicates the threshold of high excitability at ch = 2. Right subpanel shows the probability of high excitability p(c > ch). (A-D) The seizure is observed to start and remain restricted in the right temporal lobe (yellow circle, panels A, B). The result of the inference in addition points to the involvement of several regions in the right occipital lobe (magenta square, panel B). The regions identified by the inference as possibly epileptogenic are mainly located in the right temporal lobe (green circle, panel D), however, the inference also points to a possible epileptogenic zone in the right occipital lobe (blue square, panel D).

