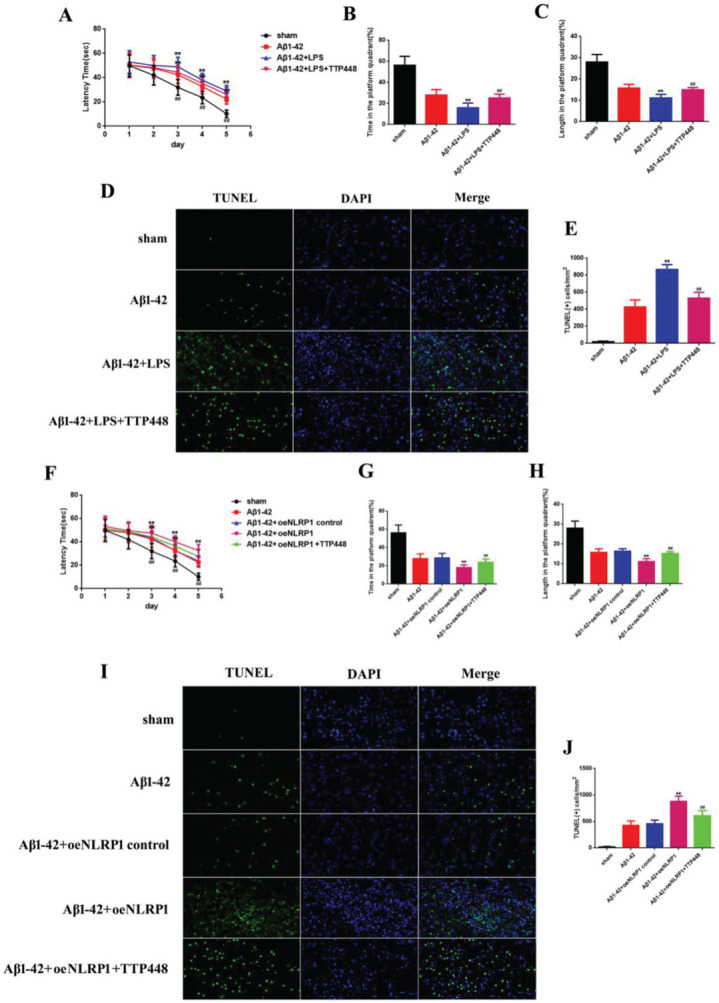
Figure 3. (A) The latency time of, (B) the time spent by, and (C) the length covered by, the mice in the platform quadrant in the Morris water maze. (D) TUNEL Immunofluorescence assay (×400). (E) TUNEL (+) cells in samples from the sham, Aβ1-42, Aβ1-42+LPS, and Aβ1-42+LPS+TTP488 groups. (F) The latency time, (G) the time, and (H) the length covered in the platform quadrant in the Morris water maze. (I) TUNEL immunofluorescence assay (×400) and (J) TUNEL (+) cells in samples from the sham, Aβ1-42, Aβ1-42+control oeNLRP1, Aβ1-42+oeNLRP1, and Aβ1-42+oeNLRP1+TTP488 groups (Aβ1-42+LPS or Aβ1-42+oeNLRP1 vs. Aβ1-42 group, **p<0.05; Aβ1-42+LPS+TTP488 or Aβ1-42+oeNLRP1+TTP488 vs. Aβ1-42+LPS or Aβ1-42+oeNLRP1 group, ## p<0.05, n=6 per group).

