
Figure 1.
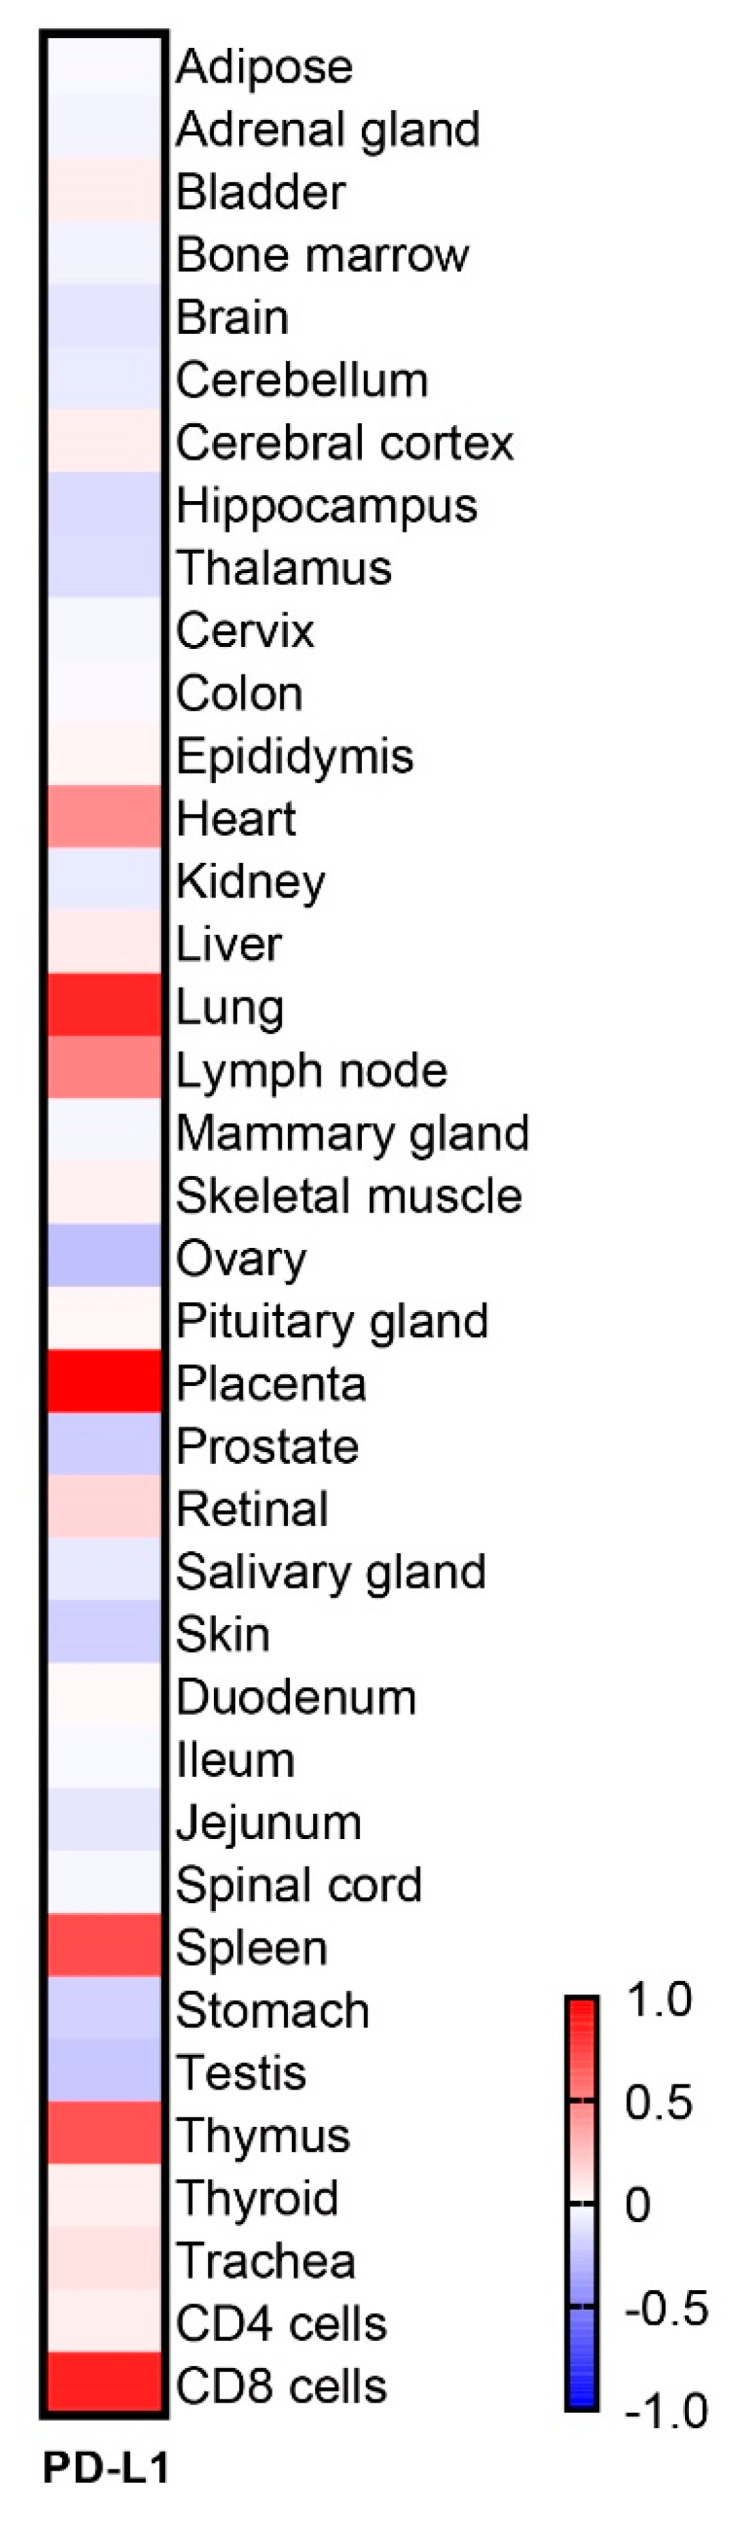
The distribution of PD-L1 in various healthy human organs. Heatmap to visualize the expression of PD-L1 by an RNA-seq data set analysis.
Official websites use .gov
A
.gov website belongs to an official
government organization in the United States.
Secure .gov websites use HTTPS
A lock (
) or https:// means you've safely
connected to the .gov website. Share sensitive
information only on official, secure websites.
The distribution of PD-L1 in various healthy human organs. Heatmap to visualize the expression of PD-L1 by an RNA-seq data set analysis.