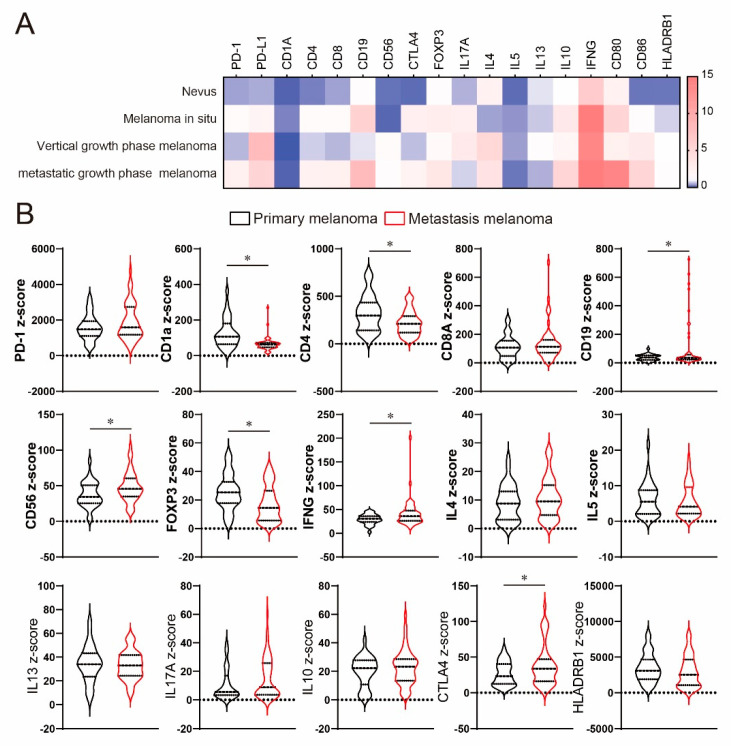
Figure 3.
Gene expression in the tumor in patients with melanoma. (A) Heatmap representing relative gene expression compared with healthy skin. (B) Violin plots showing the differences in gene expression in primary melanoma and metastatic melanoma. All p-values were obtained by Student’s t test: *, p < 0.05.

