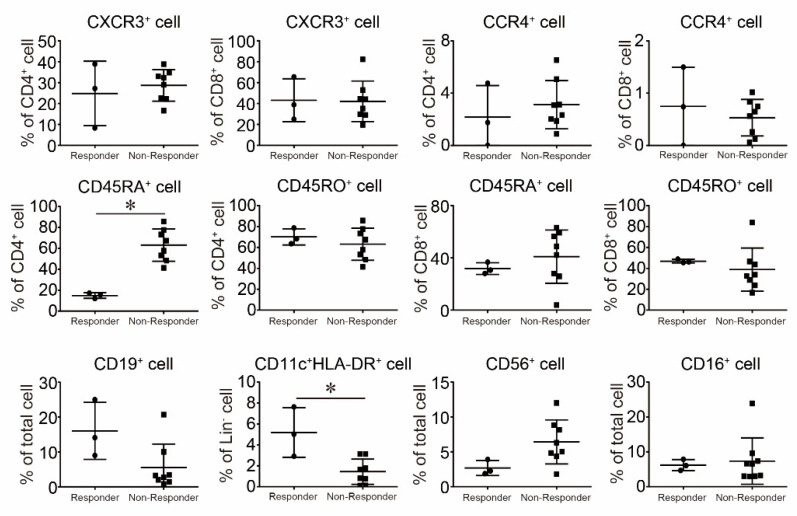
Figure 5.
The Comparison of the Frequencies of Immune Cells between Responders and Non-Responders to Nivolumab. The frequencies of each immune cell were evaluated by FACS and we compared the differences in frequency between responders and non-responders to nivolumab. Results are expressed as the mean ± SE. All p-values were obtained by Student’s t test: *, p < 0.05.

