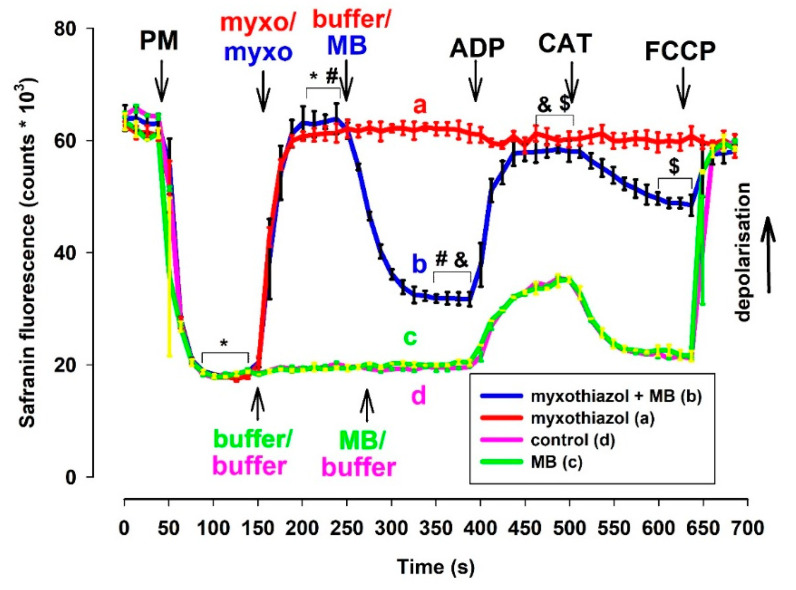
Figure 2.
Effects of MB (2 µM) on the membrane potential in complex III-inhibited mouse mitochondria. Δψm was measured via safranin O fluorescence as described in Materials and Methods. Safranin was applied to pyruvate plus malate (5-5 mM) supported mitochondria; myxothiazol (1 µM) was used for inhibiting complex III. Trace a, red: inhibitor (myxothiazol) was added, trace b, blue: inhibitor and MB were added, trace c, green: MB was added, and trace d, pink: control condition. Further additions were: ADP (2 mM), CAT (2 µM), FCCP (250 nM), all as indicated. Traces represent the average safranin signals ± S.E.M at n = 3. *, #, &, $ represent significant difference (p < 0.05) relative to the conditions indicated.

