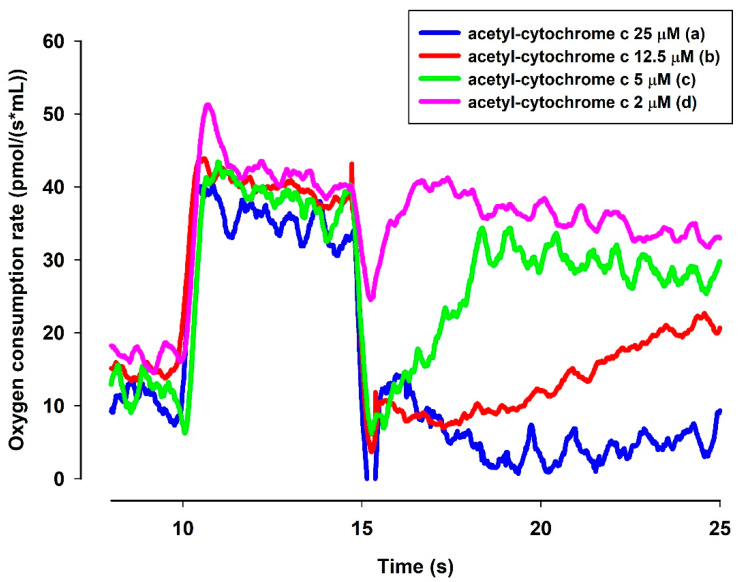
Figure 8.
Effects of MB and ac-cyt. c on the oxygen consumption in the presence of NADH. The standard medium (see Materials and Methods) was supplemented with NADH (250 µM). All of the traces were supported by MB (2 µM) and ac-cyt. c (trace a, blue 25 µM; trace b, red 12.5 µM, trace c, green 5 µM, trace d, pink 2 µM). Traces are representatives of three independent measurements.

