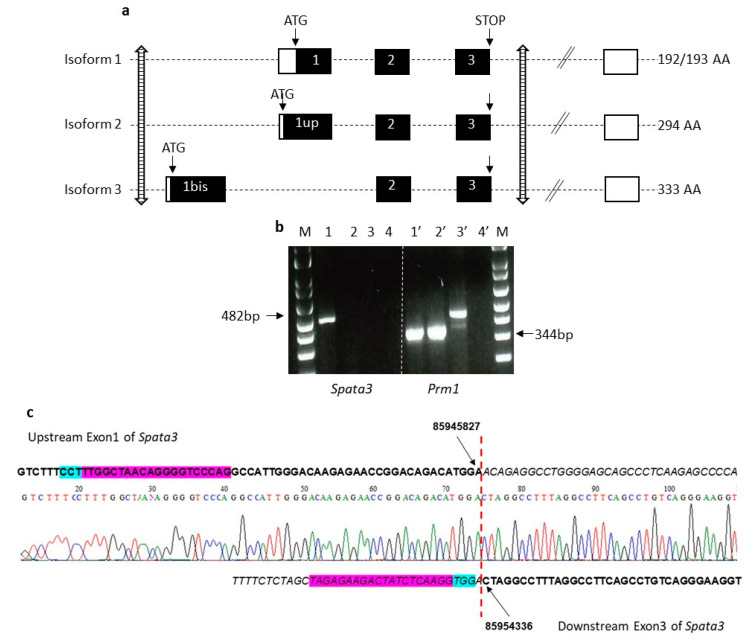
Figure 2.
Strategy of deletion of the mouse Spata3 gene. (a). Map of the mouse Spata3 gene locus. The organization of the mouse Spata3 gene is represented with the main exons (coding in black boxes, non-coding in white boxes). Isoforms 1, 2 and 3 represent the major isoforms. The position of the sites targeted by RNA guides is marked by striped arrows. Genome version GRCm38.p6. (b). Expression of Spata3 and Prm1 genes in testis samples. 1 and 1′, wild-type (WT) cDNA; 2 and 2′, knock-out animals (KO) cDNA; 3 and 3′, WT genomic DNA; 4 and 4′, negative control; M, molecular weight marker. (c). Chromatogram of the deletion site including alignment with the WT sequence. The RNA guides are in purple and the PAM sites in blue. The positions of deletion sites are indicated.

