Fig. 1.

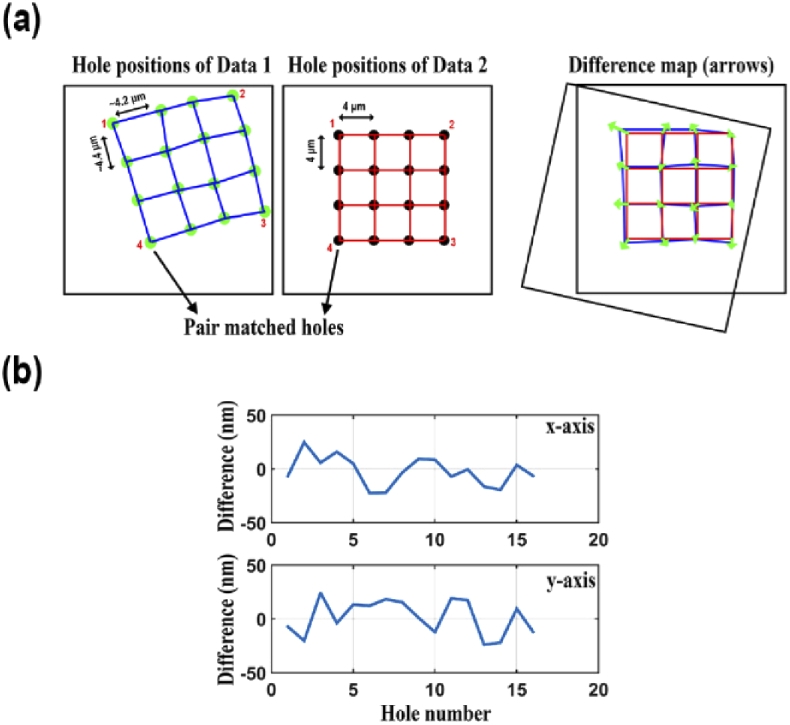
Illustration of difference analysis between pairs of hole positions. (a) Visualization of the difference map between two data sets. (b) Line plots of the differences along the x and y axes.

Illustration of difference analysis between pairs of hole positions. (a) Visualization of the difference map between two data sets. (b) Line plots of the differences along the x and y axes.