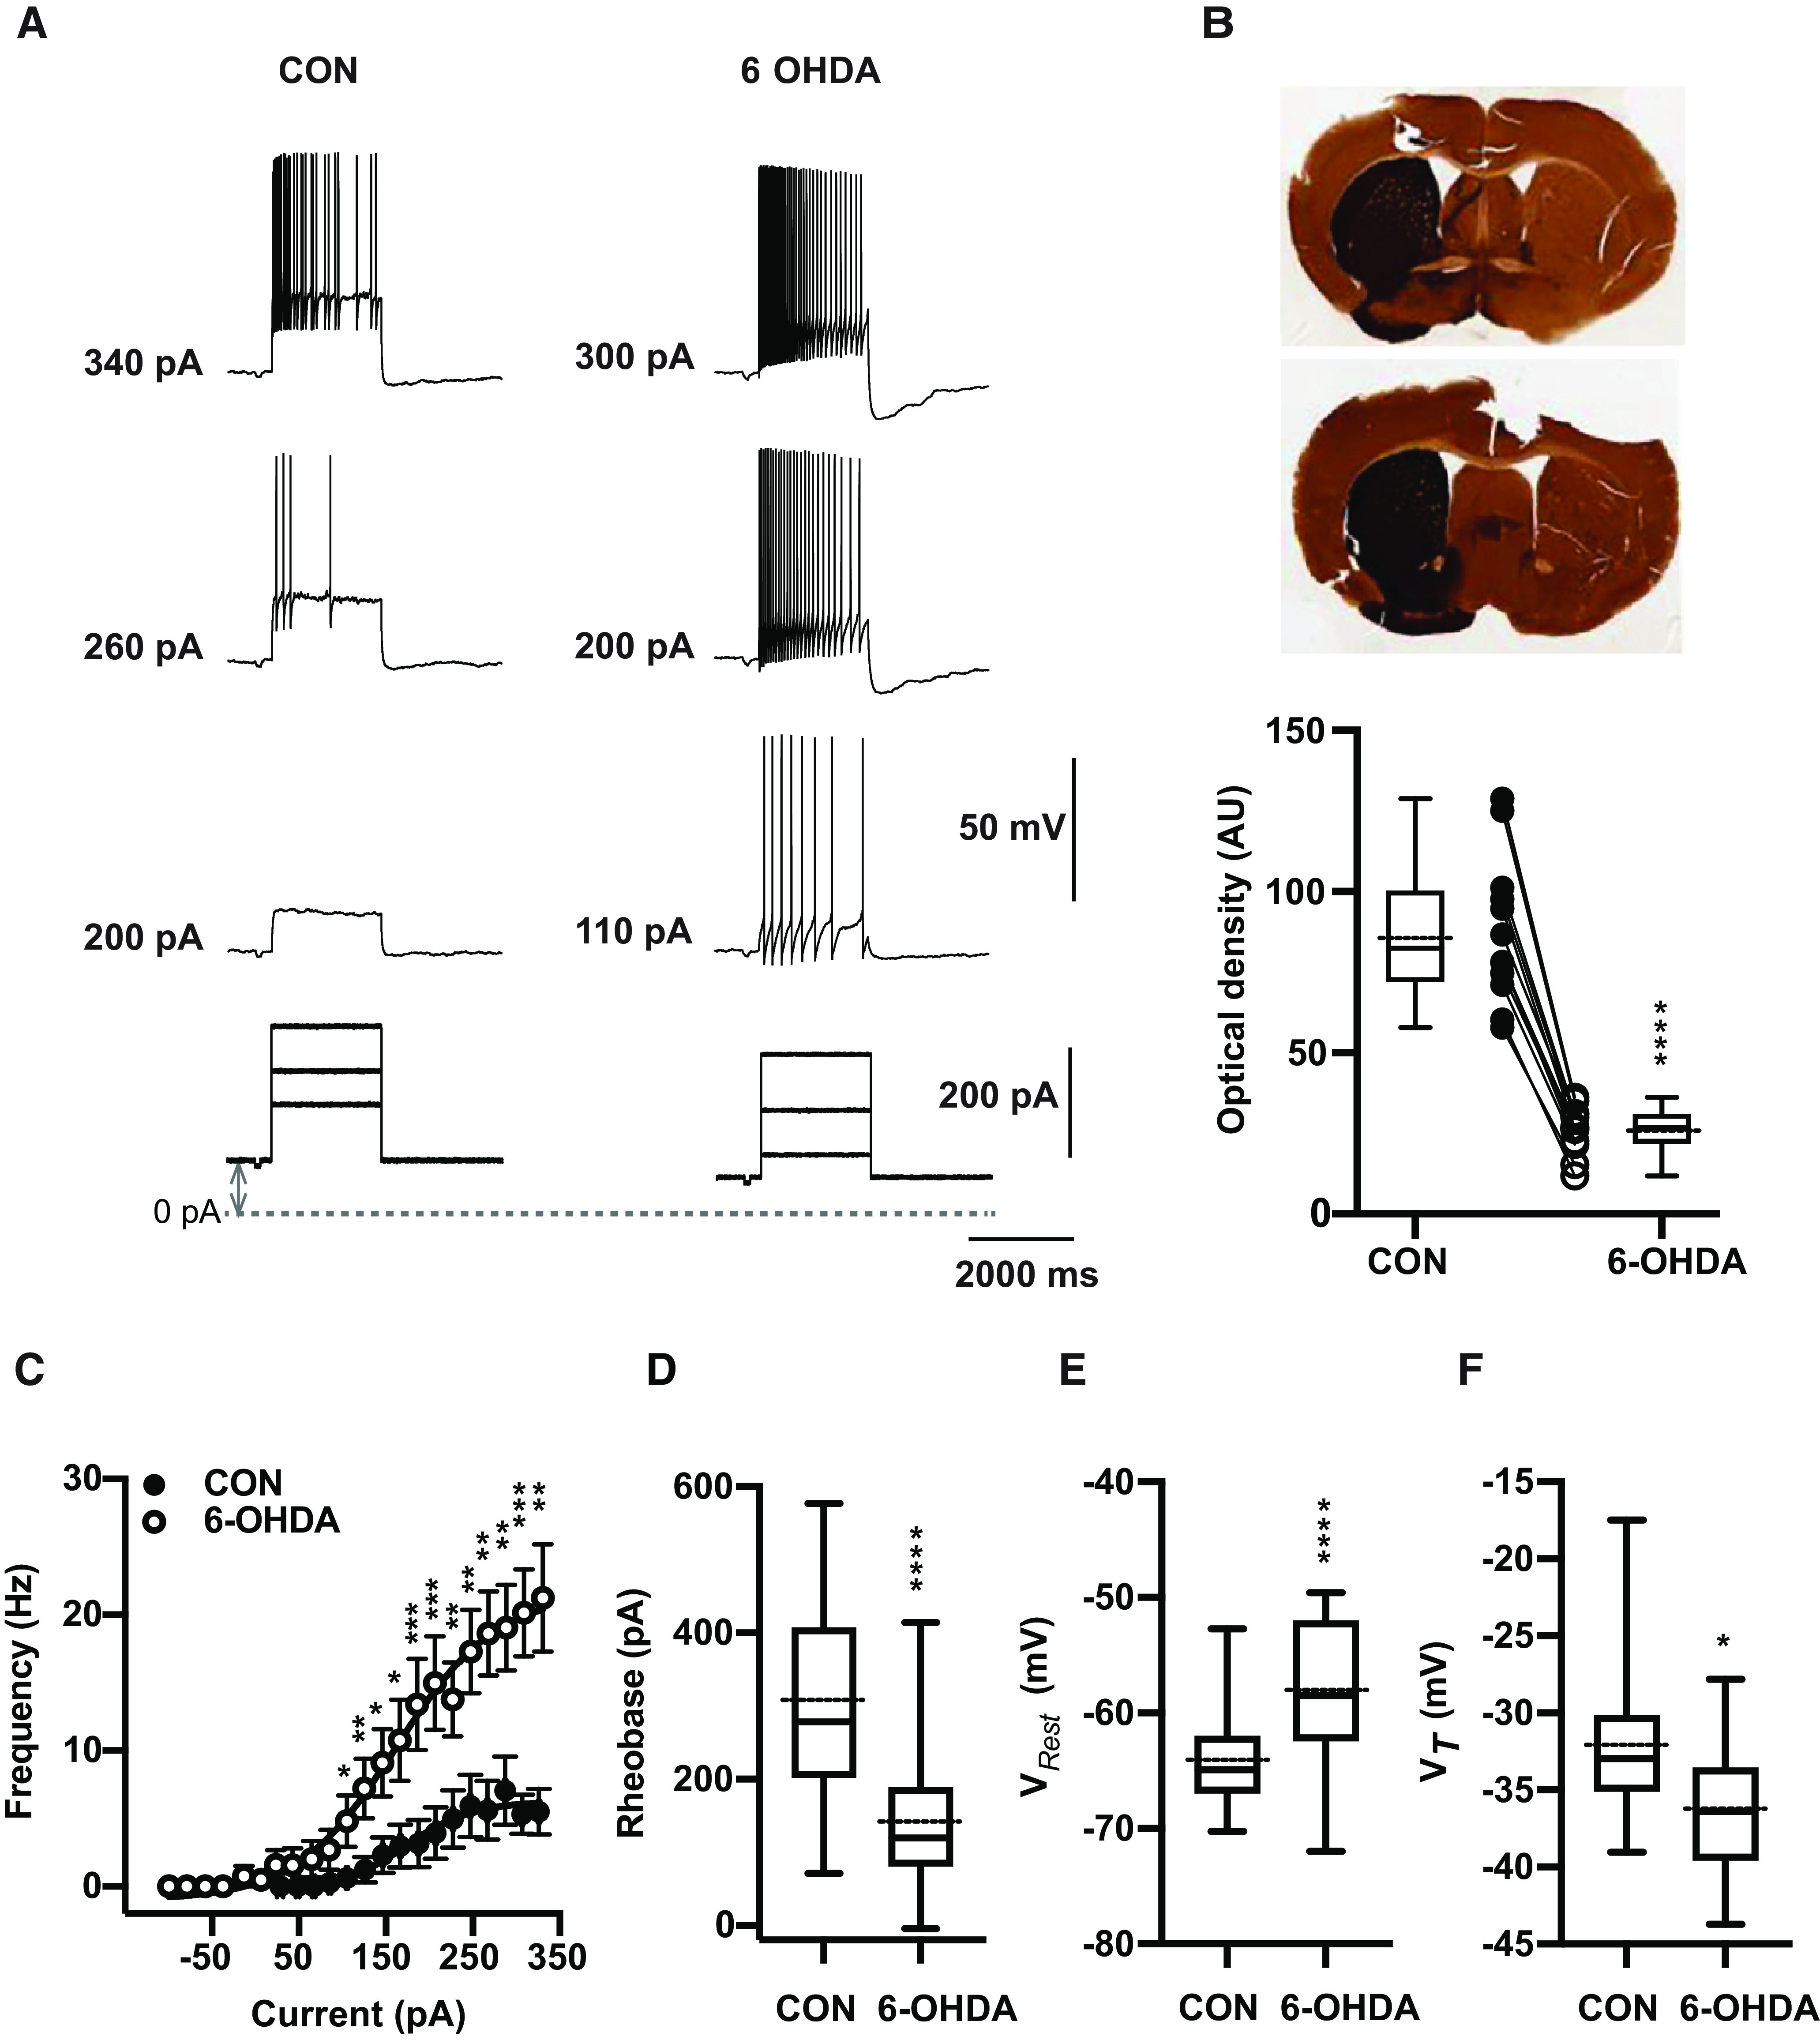
Figure 1.

6-OHDA induced dopamine depletion elicits hyperexcitability in ventral motor thalamus region. A, Characteristic voltage responses to increasing current injections (bottom) recorded in a representative neuron of control mouse (CON, left upper panel) and of mouse 20 weeks after injection with 6-OHDA (right upper panel). To block glutamatergic and GABAergic synaptic inputs, DNQX (AMPA/kainate receptor antagonist, 10 μm), D-AP5 (NMDA receptor antagonist, 50 μm), and gabazine (10 μm) were applied in both situations. The dashed line designates the 0-pA level of bias current and up-down gray arrow indicate bias current. In these examples, baseline membrane potentials (CON: −65 mV and 6-OHDA: −67 mV) were depolarized up to −55 mV by applying bias currents (CON: 100 pA and 6-OHDA: 70 pA). B, Verification of successful 6-OHDA lesioning was achieved by TH staining. Top panel, Representative digitized images of coronial striatal sections showing example TH staining in control (left) and lesioned (right) hemispheres of two individual mice after administration 1 μl of 6-OHDA solution in the medial forebrain bundle. Top picture shows 68% decrease in TH immunoreaction of lesioned dorsal striatum compared with the non-lesioned side (27.9 vs 88.6 AU) four weeks after dopamine injection. At bottom, image of striatum showing 70% reduction in TH staining (21.6 vs 71.11 AU) 5 months after 6-OHDA injection. Bottom panel, On average, TH immunoreactivity calculated based on optical density was significantly higher at non-injected site compared with 6-OHDA-treated side (CON vs 6-OHDA side: 87.8 ± 6.6 vs 26.2 ± 2.1, n = 12; paired t test, p < 0.0001). Individual mice are shown as line plots between the box plots. C, Dopamine deficit for 5–40 weeks significantly enhanced firing frequency and shifts the F-I curve to the left (open circles) compared with controls (filled circles; CON: n = 19 vs 6-OHDA: n = 17; Mann-Whitney test, p ≤ 0.026). The bias given to depolarize neurons up to −56.1 mV [−64.9, −50.5] to avoid T-type burst spiking was significantly higher for neurons from 6-OHDA-treated than control mice (Mann–Whitney test, p = 0.04; see Materials and Methods). The data are binned along the x-axis every 20 pA, as the application of different bias current for different cells did not result in the same exact current injection values for each neuron. Each circle represents mean ± SEM. D, For each individual neuron included in panel C, a Boltzmann sigmoidal fit was done based on injected current-firing rate relationship and tonic rheobase current that induced action potentials firing at 3 Hz was measured. Average tonic rheobase was significantly reduced by half after dopamine deficit (on right) compared with controls (CON: n = 19 vs 6-OHDA: n = 17; Mann–Whitney test, p = 0.0001). E, On average, VRest was depolarized 6.4 mV higher in 6-OHDA-treated (CON: −64.9 mV [−70.3,−52.7], n = 46 vs 6-OHDA: −58.5 mV [−72.0,−49.6], n = 31; Mann–Whitney test, p < 0.0001). F, Action potential VT showed significant reduction compared with controls (CON: n = 18 vs 6-OHDA: n = 17; t test, p = 0.0114; the same set of neurons as in panels C, D). Box and whisker plots represent medians, quartiles, and 5th–95th percentiles with solid horizontal lines. The sample mean is shown as horizontal dotted line.
Figure Contributions: Edyta K. Bichler conducted experiments, performed statistical analysis, and prepared figure. Dieter Jaeger reviewed data and analysis.
