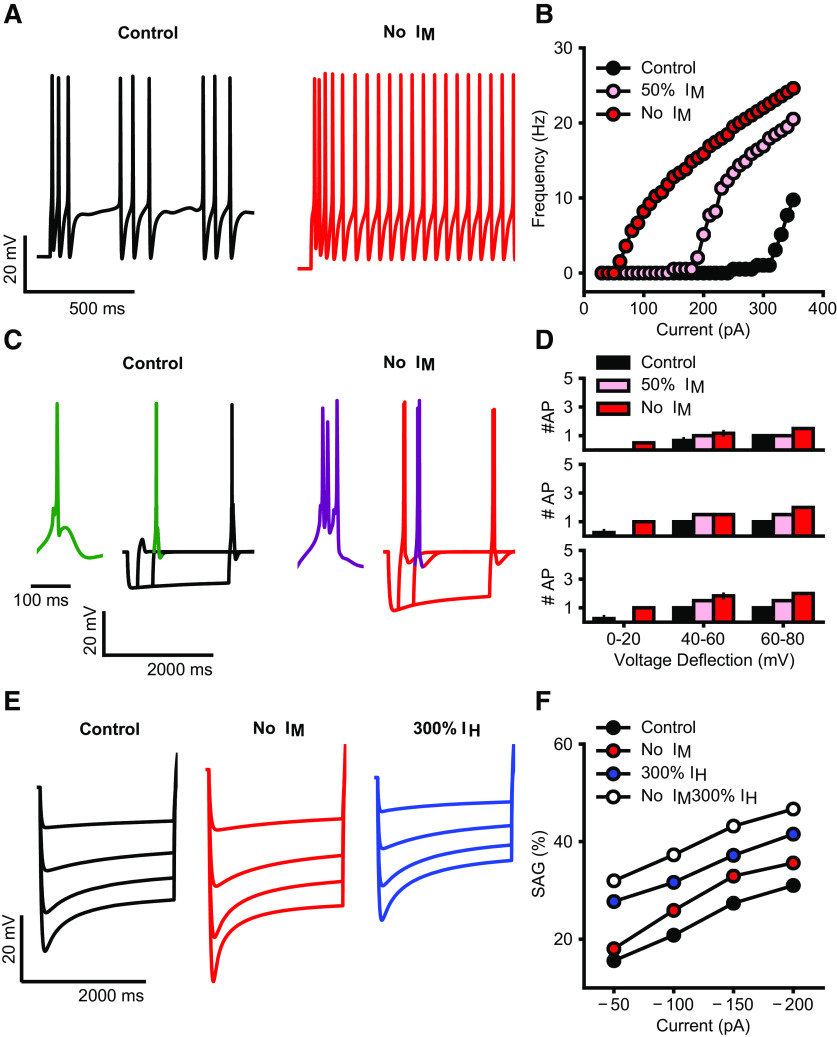
Figure 6.
A, Simulated firing of BGMT thalamocortical neuron to somatic current injection (350 pA; 2 s of duration) for control (black trace) and after IM blockade (red trace). For both, membrane potential was held at ∼−64 mV to inactivate T calcium channels and evoke tonic firing on depolarization. IM blockade increases the model firing rate (compare black and red traces). B, Injected current-firing rate relationship of the model (F-I plot) for control (black), after 50% reduction (pink) and full blockade (red) of IM current, with current intensities of 30–360 pA. IM reduction and blockade shifts the F-I curve leftward, resulting in a decrease in spike threshold as well as an increase in firing rate. C, Rebound bursts in the model neuron evoked by hyperpolarizing current steps (−100 pA) of different durations (200, 500, 2000 ms), for control (black) and after IM blockade (red). Insets show an expanded wave forms of a burst (green, purple). Membrane potential was held at ∼−71 mV. IM reduction increases the rebound burst duration, i.e., spike count (compare green and purple wave form). D, Spike count in rebound bursting as in C, evoked by current steps of 200 ms (top), 500 ms (center), and 2000 ms (bottom), for control (black), after 50% reduction (pink) and full blockade (red) of IM conductance. E, Sag generated in response to hyperpolarizing current pulses of increasing intensities (50–200 pA; no holding current) for control (black), after IM blockade (red), and 200% increase of IH (blue). F, Sag amplitude versus hyperpolarizing current intensity for control (black), after IM blockade, 200% increase of IH (blue), or combination of both changes (white). IM blockade makes a small increase in sag amplitudes (compare red and black), while IH increase brings the amplitudes to similar levels as observed in 6-OHDA-lesioned condition (compare blue, white, and black), combination of both changes allows to replicate the increase in the sag observed experimentally (compare white and black).
Figure Contributions: Francesco Cavarretta conducted simulations, performed analysis, and prepared figure. Dieter Jaeger reviewed data and analysis.

