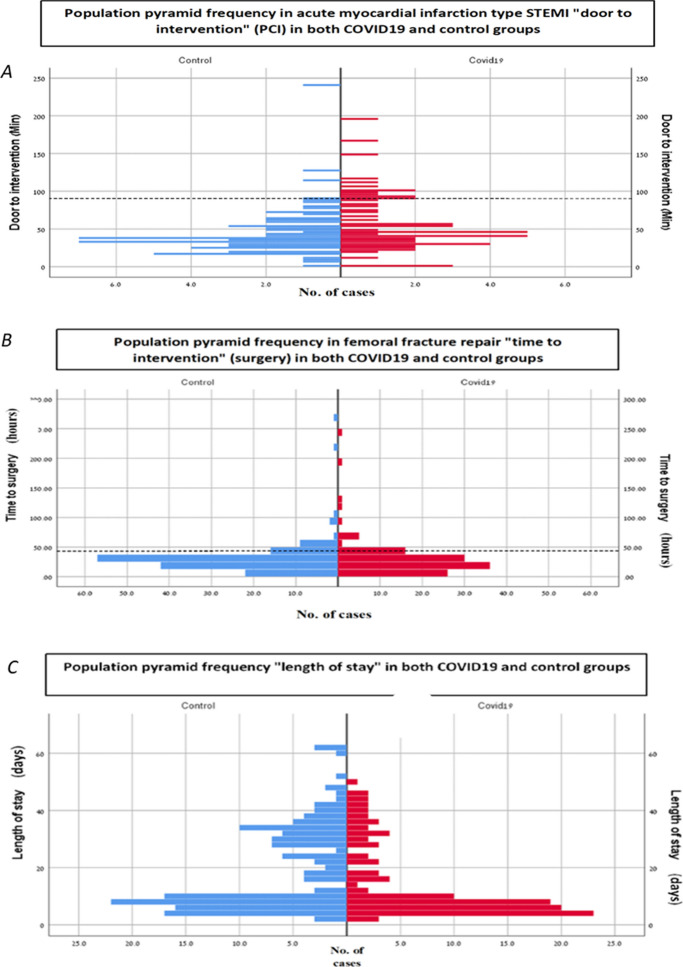
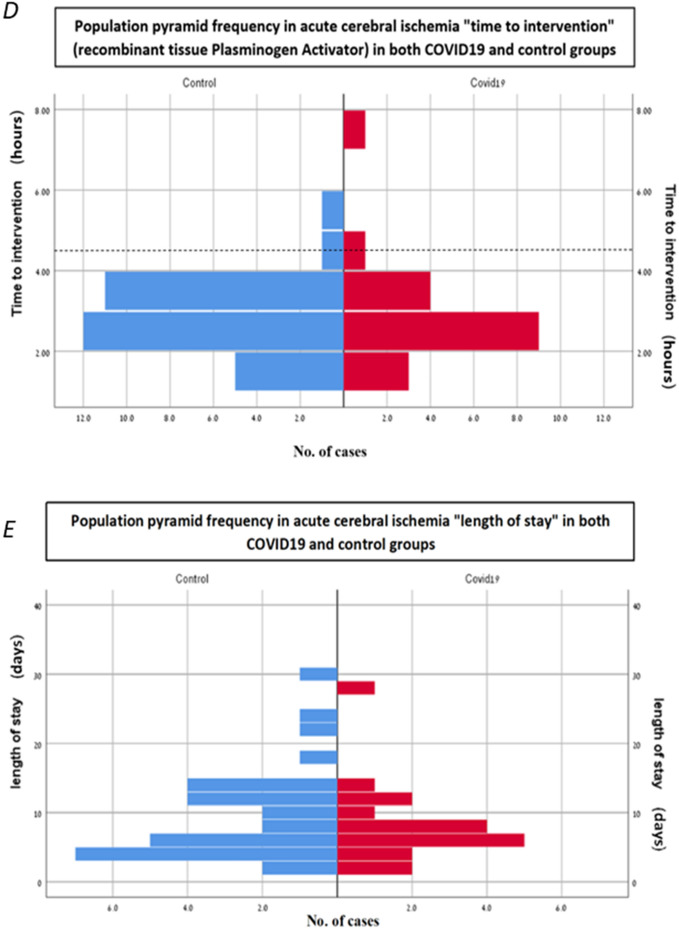
Fig. 1.
Demonstrate a population pyramid histograms concerning the three quality measures: acute ST-segment elevation myocardial infarction, acute femur fracture and acute cerebral ischemia, comparing both parallel periods: covid-19 group and the control group. a Represent time to percutaneous coronary intervention in minutes by frequency cases comparing both parallel periods. The dash line represents the goal established to reduce mortality and morbidity (a time-to-PCI ≤ 90 min). b Represent the time to femoral surgery in hours by frequency cases comparing both parallel periods. The dash line represents the goal established to reduce mortality and morbidity (a time-to-surgery ≤ 48 h). c Demonstrate a population frequency and length of hospitalization in days after femoral repair. d Represent the time to tissue plasminogen activator (thrombolysis) in hours by frequency cases while comparing both parallel periods in acute cerebral ischemia. The dash line represents the goal established to reduce mortality and morbidity (a time-to-tPa ≤ 4.5 h). e Demonstrate a population pyramid by histogram frequency demonstrate length of hospitalization in days while comparing both parallel periods in acute cerebral ischemia


