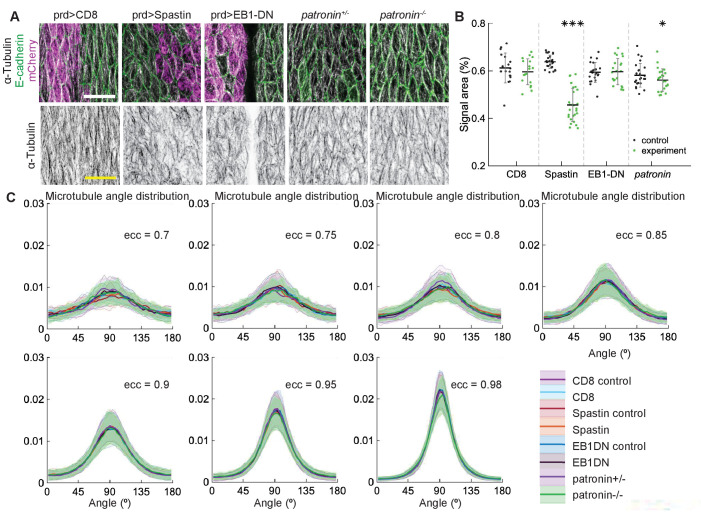
Appendix 1—figure 2. Changes to microtubule dynamics and stability do not affect their alignment.
(A) Apical view of epidermis from control embryos and with altered microtubules. Left-to-right: embryos with CD8-Cherry (control), Spastin (Spas), and EB1-DN expressed using paired::Gal4, heterozygous Patronin -/+, and homozygous Patronin -/- embryos. Cells expressing CD8-Cherry and EB1-DN are visualized by direct fluorescence of mCherry directly fused to respective proteins, whereas cells expressing Spastin are visualized by coexpression of CD8-Cherry (magenta, top row). Cell outlines were visualized by immunostaining against E-cadherin (green, top row), and microtubules by immunostaining against α-Tubulin (white, top row; black, bottom row). Embryos were imaged across all developmental stages between stages 12 and 15. Scale bar - 10 µm. The area with no microtubules in the example of EB1-DN expression corresponds to a segmental groove, where the cells are out of imaging focus. (B) Quantification of microtubule density in each genotype. Internal controls (cells not expressing paired::Gal4) were used for CD8-Cherry, Spastin, and EB1-DN overexpression. For Patronin, heterozygous and homozygous embryos were compared. *** - , * - in comparison to respective control. (C) The microtubule angle distributions for each eccentricity (±0.025) do not significantly differ between all genotypes and relative to controls. The distributions are shown as mean (solid line) with standard deviation (shading). For each eccentricity, the displayed experimental distribution is the mean distribution averaged across cells with the set eccentricity (±0.0025 for and ±0.005 for ). The number of cells per eccentricity per genotype ranged from 24 to 515.

