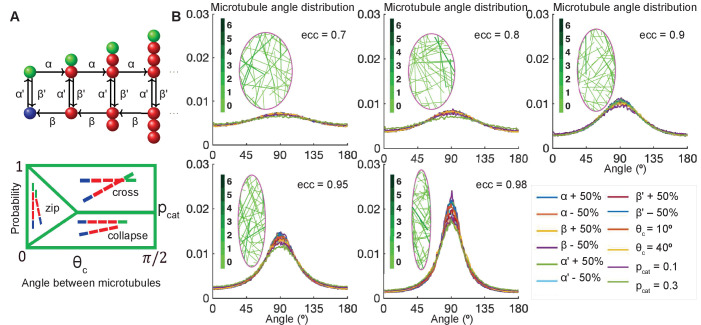
Figure 2. Stochastic simulations demonstrate robustness of microtubule self-organization.
(A, top) Markov chain: each microtubule grows from the minus-end (blue) at the rescue rate , polymerizes at the rate if it is stable with a T. GTP cap (green), undergoes catastrophe losing the T.GTP cap at the rate , depolymerizes at the rate β, and regains the T.GTP cap with the rescue rate . (A, bottom) Parameterization of the effect of crosslinking proteins on microtubule-microtubule interactions, where the probability of an interaction scenario depends on the angle between microtubules. Here is the critical angle of zipping, and is the probability of catastrophe. (B) Sensitivity analysis of the microtubule angle distribution. Left: Snapshots of zipping simulations in cells (magenta) of different eccentricities; for the base-level parameters , and . Interacting microtubules form bundles, the colorbar indicates the number of microtubules in a bundle. Right: The microtubule angle distributions do not vary significantly in a wide parameter range, suggesting robustness of the microtubule self-organization. The distributions are shown for the variations of as compared to , variable critical zipping angle and probability of catastrophe .

