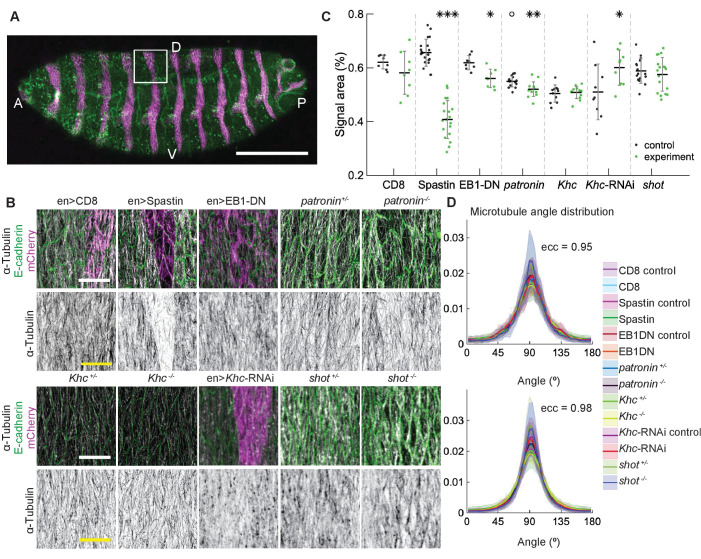
Figure 4. Changes to microtubule dynamics and stability do not affect their alignment in the Drosophila embryonic epidermis in vivo.
(A) An overview image of a Drosophila embryo at stage 15 of embryonic development with cell outlines visualized with E-cadherin (green), and engrailed-expressing stripes are visualized by direct fluorescence of mCherry (magenta). The white square demonstrates the area used for analysis on microtubule organization as shown in (B). Anterior (A), posterior (P), dorsal (D), and ventral (V) sides of embryos are labeled. Scale bar - 100 µm. (B) Apical view of epidermis from control embryos and with altered microtubules. Top, left-to-right: embryos with CD8-Cherry (control), Spastin (Spas), and EB1-DN expressed using engrailed::Gal4, heterozygous Patronin +/-, and homozygous Patronin -/- embryos. Bottom, left-to-right: heterozygous Khc +/- and homozygous Khc -/- embryos, embryos expressing Khc-RNAi, and heterozygous shot +/- and homozygous shot -/- embryos. Cells expressing CD8-Cherry and EB1-DN are visualized by direct fluorescence of mCherry fused to respective proteins, whereas cells expressing Spastin and Khc-RNAi are visualized by coexpression of CD8-Cherry (magenta). Cell outlines were visualized by immunostaining against E-cadherin or native fluorescence of E-cadherin-GFP for Khc-RNAi (green, top row), and microtubules by immunostaining against α-Tubulin (white, top row; black, bottom row). Scale bar - 10 µm. (C) Quantification of microtubule density in each genotype. Internal controls (cells not expressing engrailed::Gal4) were used for CD8-Cherry, Spastin, EB1-DN, and Khc-RNAi. For Patronin, Khc and shot, heterozygous and homozygous embryos were compared. *** - , ** - , * - in comparison to respective control; ° - in comparison to CD8-Cherry control. (D) The microtubule angle distributions for each eccentricity (±0.025 for and ±0.005 for ) do not differ between all genotypes and relative to controls. The distributions – mean (solid line) with standard deviation (shading) – are produced by binning cells in each genotype by eccentricity with the number of binned cells from 32 to 833.

