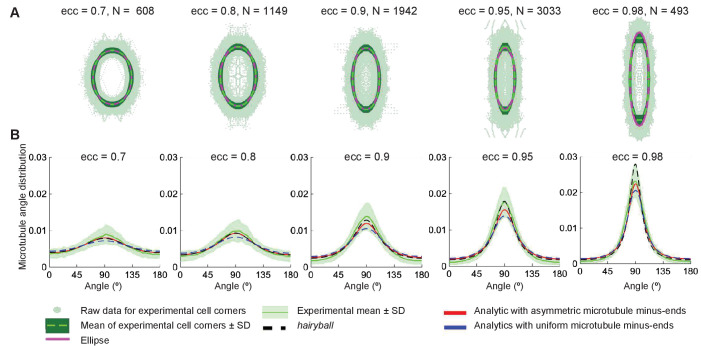
Figure 8. Agreement between the analytical and experimental microtubule self-organization on averaged cell-shape.
(A) Experimental cell shapes for eccentricities 0.7—0.98. The experimental cell boundary data points (light green points), its standard deviation (darker green envelope) around the radial mean (dark green line). The ellipse (dashed magenta) closely approximates the experimental mean shape. The graphs show the corresponding microtubule angle distributions. (B) The analytical distribution with asymmetric minus-ends (red) has better agreement with the experimental mean (dark green line) (± SD is the light-green envelope), comparing to the uniform minus-end density (blue); the hairyball has good agreement up to eccentricity 0.95 with the experimental mean.

