. 2021 Feb 18;10:e63049. doi: 10.7554/eLife.63049

Figure 3. Piezo mediates enteric neuron responses to crop-distending stimuli.

(A) Flies of genotypes indicated were provided solutions of (1) sucrose, (2) sucralose, (3) water alone after a period of water deprivation (water), or (4) water alone ad libitum for 24 hr (control). Representative images of native CaLexA-induced GFP reporter (green) and CD8RFP (red) fluorescence visualized in enteric Gr43a neurons (left), Piezo neurons (middle), or Piezo neurons lacking Piezo (right), scale bar 10 μm. (B) Quantification of CaLexA-induced GFP fluorescence in individual RFP-expressing neurons from flies in (A). n (from top to bottom): 59, 64, 43, and 67 Gr43a neurons from 13, 14, 9, and 15 flies; 61, 61, 59, and 66 Piezo neurons from 11, 11, 10, and 12 flies; 60, 60, 33, and 37 Piezo-null Piezo neurons from 11, 11, 5, and 6 flies, mean ± SEM, ***p<0.0001, ns: not significant by ANOVA Dunnett’s multiple comparison test. (C) Visualization of the crop from flies given stimuli indicated after 24 hr (sucrose, sucralose, control) or 15 min (water), scale bar 100 μm. See Figure 3—figure supplement 1 and source data.

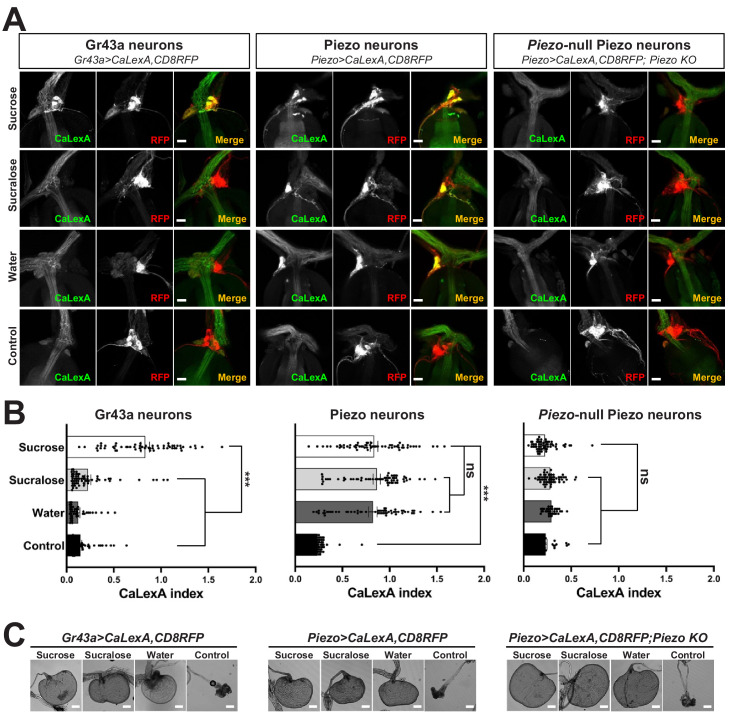
Figure 3—source data 1. Numerical data to support the graph in Figure 3.

Figure 3.

Figure 3—figure supplement 1. Responses and innervation patterns of Piezo neurons in wild-type and Piezo knockout flies.

Figure 3—figure supplement 1.

(A) Piezo-Gal4; UAS-CaLexA; UAS-Trpa1 flies were placed at 30°C for indicated time periods with ad libitum food. Representative pseudocolor images (left) and quantification (right) of native CaLexA-induced GFP reporter fluorescence in the hypocerebral ganglion. GFP fluorescence was visually transformed to a color map indicating fluorescence intensity. n (left to right): 10, 10, 18, 11, and 12 flies, mean ± SEM, scale bar 10 μm. (B) Piezo-Gal4; UAS-CaLexA; UAS-CD8RFP flies were provided for 24 hr with sucrose, water alone (starved), or regular food ad libitum (ad libitum). Representative images (left) of native CaLexA-induced GFP reporter (green) and CD8RFP (red) fluorescence, and quantification (right) of CaLexA-induced GFP fluorescence in individual RFP-expressing neurons. n (left to right): 54, 82, and 44 neurons from 9, 16, and 8 flies, mean ± SEM, ***p<0.0001, ns: not significant by ANOVA Dunnett’s multiple comparison test, scale bar 10 μm. (C) Crop sizes from wild-type flies fed as indicated. n (left to right): 17, 19, and 28 flies, mean ± SEM, ***p<0.0001 by ANOVA Dunnett’s multiple comparison test. (D) Piezo-Gal4; UAS-CaLexA; UAS-Trpa1 (Piezo neurons) and Piezo-Gal4; UAS-CaLexA; UAS-Trpa1; Piezo knockout (Piezo-null neurons) flies were placed at 30°C with ad libitum food for 24 hr. Representative pseudocolor images (left) and quantification (right) of native CaLexA-induced GFP reporter fluorescence in the hypocerebral ganglion. GFP fluorescence was visually transformed to a color map indicating fluorescence intensity. n: 22 (left) or 23 (right) flies, mean ± SEM, ns: not significant by unpaired t-test, scale bar 10 μm. (E) Wholemount images of the digestive tract from Piezo-Gal4; UAS-CD8RFP and Piezo-Gal4; UAS-CD8RFP; Piezo knockout flies visualized with immunofluorescence for RFP (green, anti-RFP) and a fluorescent Phalloidin conjugate (magenta) to label visceral muscle, scale bar 50 μm.
Figure 3—figure supplement 1—source data 1. Numerical data to support the graph in Figure 3—figure supplement 1.