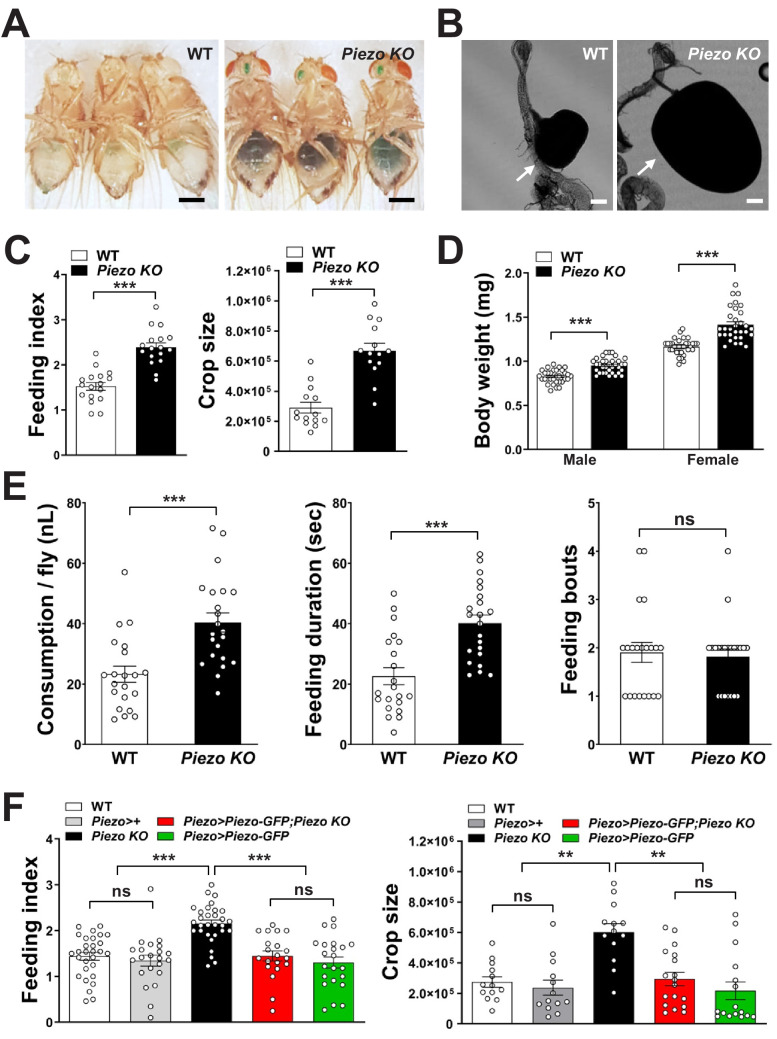
Figure 4. Piezo knockout alters fly feeding behavior.
(A) Fasted wild-type (WT) and Piezo knockout (KO) female flies were given brief access (30 min) to dye-colored food and imaged, scale bar 0.5 mm. (B) Representative images of the crop (arrow) in WT and Piezo KO flies, scale bar 100 μm, (C) Calculated feeding indices (left) and crop sizes (right) from flies in (A). n (feeding index: 17 trials involving 204 flies), n (crop size): 14 flies, mean ± SEM, ***p<0.0001 by unpaired t-test. (D) Body weights of WT and Piezo KO flies fed regular food ad libitum. n (left to right): 32, 34, 33, and 31 trials involving three flies per trial, mean ± SEM, ***p<0.0001 by unpaired t-test. (E) Feeding parameters of fasted WT and Piezo KO male flies were analyzed using the EXPRESSO assay for 30 min after food introduction to determine overall food consumption, feeding duration per bout, and the number of bouts. n: 21 (WT), 22 (PIEZO KO) flies, mean ± SEM, ***p<0.0005, ns: not significant by unpaired t-test. (F) Calculated feeding indices (left) and crop sizes (right) from Piezo rescue and control flies indicated. n (left to right) (feeding index): 29, 22, 30, 22, and 13 trials involving 12 flies per trial. n (crop size): 13, 13, 13, 18, and 16 flies, mean ± SEM, ***p<0.0005, **p<0.005 by ANOVA Dunnett’s multiple comparison test, ns: not significant by unpaired t test. See Figure 4—figure supplements 1 and 2 and source data.


