. 2021 Feb 17;10:e61409. doi: 10.7554/eLife.61409

Figure 1. Blood cell counts and gene expression analysis in the larval lymph gland.

Whole lymph gland preparations (including primary and posterior lobes [sec., tert., quat. lobes]) were analyzed for third instar larvae except where time points are mentioned. (A) Total lymph gland blood cell counts (DAPI+ cells) at the indicated time points. (B–D) Expression profiles of posterior signaling center (PSC) markers. (B) col-Gal4,UASmCD8-GFP (green) is expressed in the PSC and in the tertiary lobes; graph represents ratio of col>GFP+/DAPI+ cells. (C) hhF4f-GFP (green) and (D) Antp (red) and Ser-Gal4,UAS2xEYFP (green pseudo color) are expressed in the PSC only. (E–G) Expression profiles of medullary zone (MZ)/progenitor (green) and cortical zone (CZ)/differentiation (red) markers. (E) Tep4-Gal4,UASLifeact-RFP (green pseudo color), (F) dome-Gal4,UAS2xEGFP (green), and (G) DE-cadherin (green) expression are observed in the MZ as well as in the posterior lobes; (E) Pxn-GFP (red pseudo color), (F) P1 (red), and (G) ProPO (red) are restricted to the primary lobes. Quantification panels indicate ratios of Tep4+/DAPI+ or Pxn+/DAPI+ (E), dome+/DAPI+ or P1+/DAPI+ (F), and DE-cad+/DAPI+ (G) cells respectively. (H) Cell cycle analysis for Tep4-Gal4> FUCCI. GFP+/RFP-: G1 phase; GFP-/RFP+: S-phase, GFP+/RFP+: G2/M phase. (I) Schematic representation of the expression of indicated markers in the third instar larval lymph gland. Pri. indicates primary lobes, Sec. indicates secondary lobes, Tert. indicates tertiary lobes, and Post. indicates posterior lobes. (B–D and E–H) Yellow asterisks indicate pericardial cells. Lobes are outlined by white dashed lines. Nuclei were stained with DAPI, which is not displayed for clarity. (B–G) Kruskal–Wallis test was used for statistical analysis. **p<0.01, ***p<0.001, ns: nonsignificant, and error bars represent SEM. (B–H) Scale bar: 100 µm.

Figure 1—source data 1. Numerical data plotted and statistical analysis related to Figure 1.

Figure 1.

Figure 1—figure supplement 1. Analysis of lymph gland lobes and gene expression analysis.

Figure 1—figure supplement 1.

Whole lymph gland preparations (including primary and posterior lobes [sec., tert., quat. lobes]) are shown. (A) Table shows number of larvae that have one or two primary/secondary/tertiary/quaternary lobes during development at the indicated time points. (B–F) Shows total lymph gland blood cell counts (DAPI+ cells) at 60 hr after egg laying (AEL), 72 hr AEL, 96 hr AEL, 120 hr AEL, and 144 hr AEL, respectively. (B) Yellow and red arrowheads indicate secondary and tertiary lobes. (B–F) Kruskal–Wallis test was used for analysis of DAPI+ cells and for fold-change analysis Student's t-test was used. (G–K) Wandering third instar larvae whole lymph gland preparations showing the expression of (G): col-Gal4,UAS-GFP (green) and Col (red), (H) Tep4 (red), (I) domeMESO-GFP (green), (J) shg-GFP (green), or (K) Tep4-Gal4,UAS-RFP (red) and Hnt (green) as revealed by fluorescent immunostaining (G and I–K) or in situ hybridization (H). Nuclei were stained with DAPI (blue). Pri. indicates primary lobes, Sec. indicates secondary lobes, and Tert. indicates tertiary lobes. (G–K) Right panels: single channel images. Scale bar: (B) 50 µm, (C–K) 100 µm.
Figure 1—figure supplement 1—source data 1. Numerical data plotted and statistical analysis related to Figure 1—figure supplement 1.
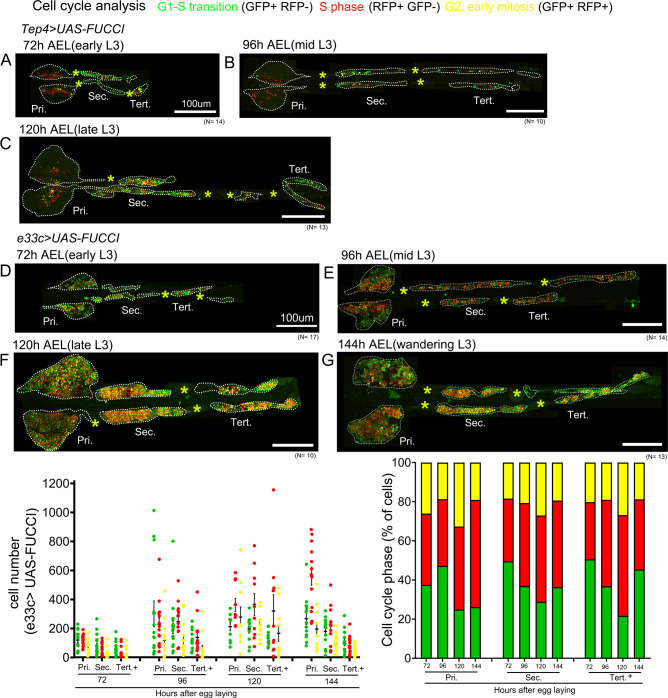
Figure 1—figure supplement 2. Blood cell progenitor cell cycle pattern.

Figure 1—figure supplement 2.

(A–G) Cell-cycle analyses for Tep4-Gal4> FUCCI (A–C) or e33c-Gal4> FUCCI (D–G) are shown at the indicated time points. GFP+/RFP-: G1 phase; GFP-/RFP+: S-phase, GFP+/RFP+: G2/early M phase. Pri. indicates primary lobes, Sec. indicates secondary lobes, and Tert. indicates tertiary lobes. Yellow asterisks indicate pericardial cells. Lobes are outlined by white dashed lines. Nuclei were stained with DAPI, which is not displayed for clarity. Scale bar: (A–G) 100 µm.
Figure 1—figure supplement 2—source data 1. Numerical data plotted and statistical analysis related to Figure 1—figure supplement 2.