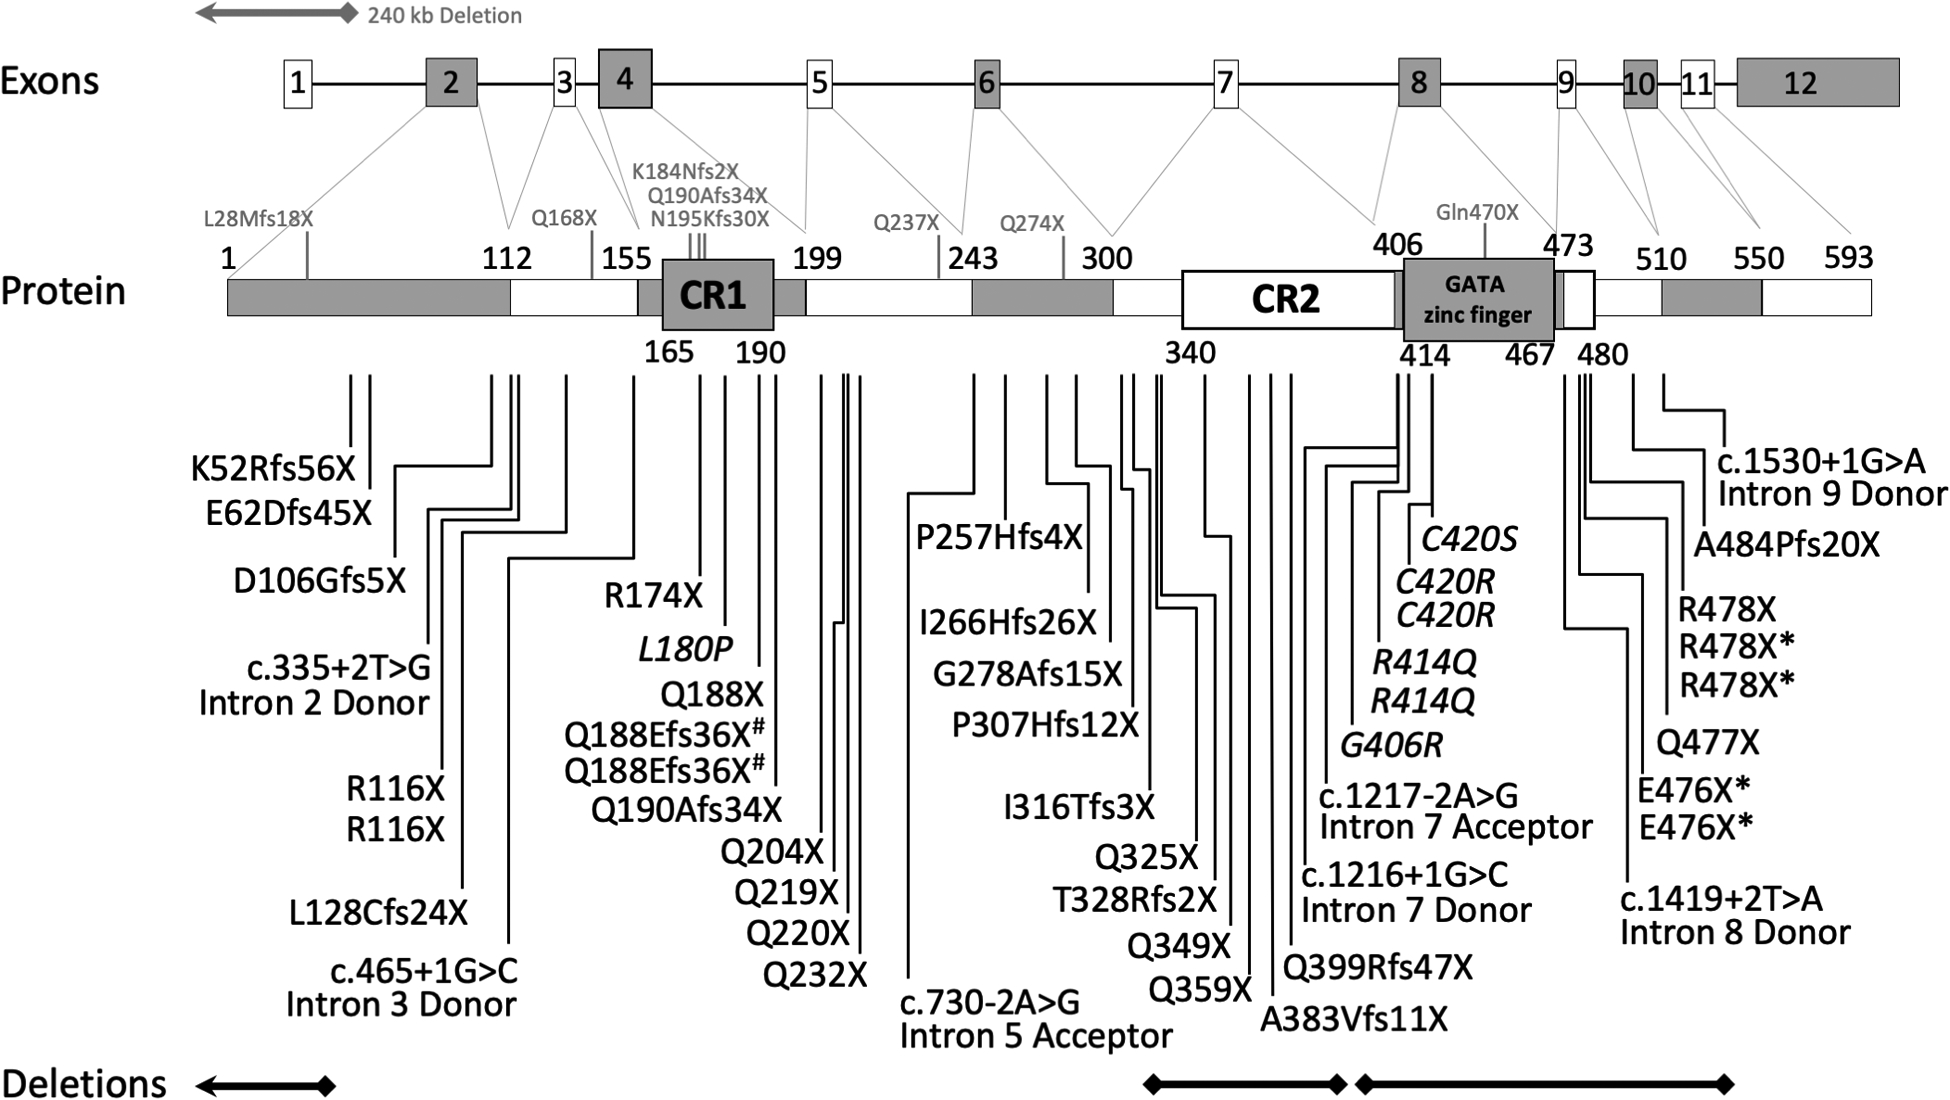
Fig. 1. Genomic and Protein Schematic Diagram with GAND variants.

All reported pathogenic GATAD2B variants from our study are represented as deletions, splice-site or protein changes below the protein diagram. Genomic deletions are represented as bars below the figure. Previously reported variants and deletions are represented with grey letters and bars above the diagram. * = monozygotic twins; # = somatic mosaic family
