
Figure 5. Zeb2os shRNA knockdown by AAV transduction in GFAP-Cre mice at 17 days after SCI.
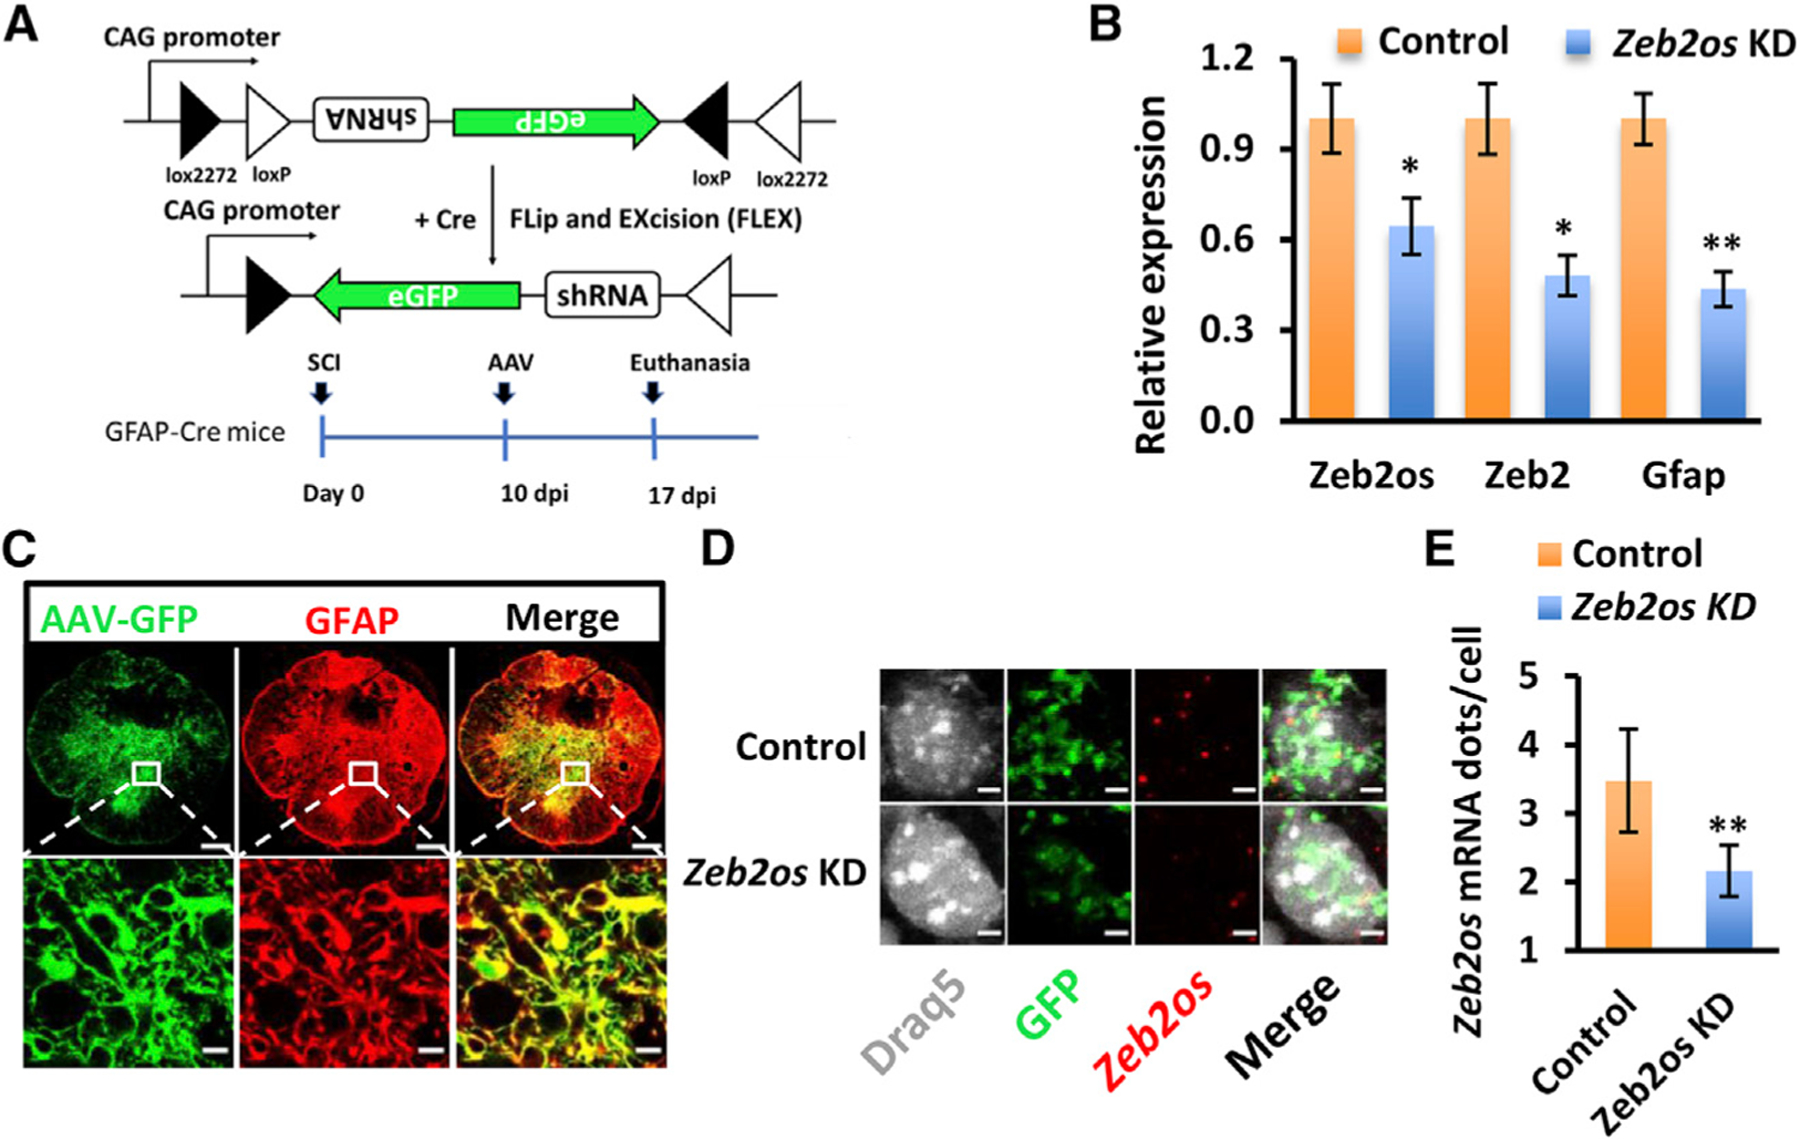
(A) Design of Cre-dependent Zeb2os shRNA KD AAV and experimental timeline of SCI followed by AAV injection in GFAP-Cre transgenic mice. Graph showing shRNA KD using AAV generated consistent results as lentivirus KD.
(B) qPCR analysis of gene expression in Zeb2os KD in primary astrocytes using AAV. Data are presented as means ± SEM; n = 3 independent experiments; *p < 0.05, **p < 0.01, Zeb2os KD versus control (independent t test).
(C) AAV transduction marker GFP (green) colocalization with GFAP (red) in spinal cord astrocytes. Top row: whole spinal cord section (Zeb2os KD rostral 800 µm distal to epicenter); bottom row: magnified region (box). (scale bar, 200 µm, top row; scale bar, 10 µm, bottom row).
(D) RNAscope and immunohistochemistry showing Zeb2os mRNA (red) expression in Zeb2os KD AAV-transduced astrocytes (green) compared to the eGFP AAV-transduced control. DRAQ5 was used for nuclear staining (white) (scale bar, 5 µm).
(E) Expression of Zeb2os mRNA dot number per cell in AAV transduced astrocytes using RNAscope (n = 3–6). Data are presented as mean ± SEM; **p < 0.01, compared with control group (independent t test).