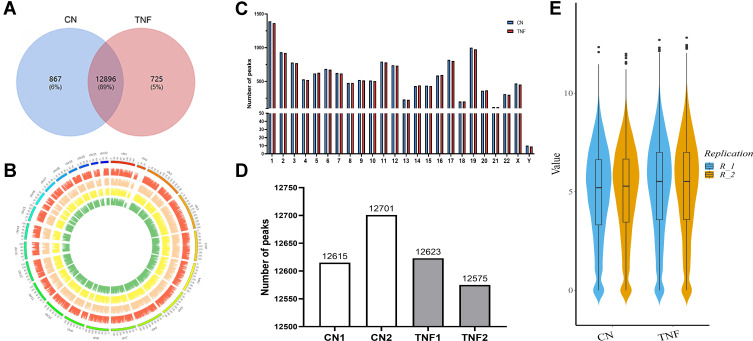
Figure 2.
Transcriptome-wide m6A-Seq revealed global m6A modification patterns in MH7A cells after stimulation with TNF-α. (A) Venn diagram of m6A modified genes in the control group and the TNF-α group. (B) The distribution patterns of m6A peaks in different chromosomes. (C) The number of m6A peaks in per chromosome. (D) The number of m6A peaks in each group. (E), Violin plot of the relative abundance of m6A peaks in each group.

