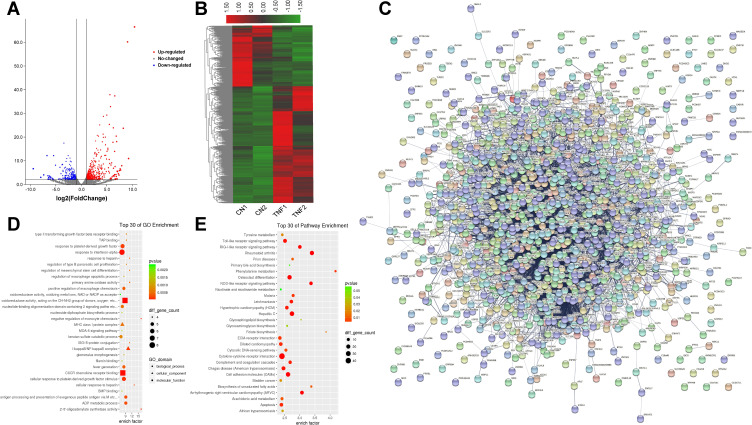
Figure 4.
Differences in the mRNA expression genes in MH7A cells after stimulation with TNF-α. (A) Volcano plot representation of microarray data on the differentially expressed mRNA genes between the control group and TNF-α group. The blue and red dots to the left and to the right of the two vertical lines indicate more than a 1.5-fold change and represent the differentially expressed genes with statistical significance. Statistical significance was defined as a fold change of 1.5 and a p-value of 0.05 between the control and TNF-α groups. (B) Hierarchical cluster analysis of differentially expressed mRNA genes between the control group and TNF-α group. Hierarchical clustering showed that the differentially expressed genes ultimately clustered into two major branches, including upregulated genes, which are labeled in red, and downregulated genes, which are labeled in green. The darker the color, the more significant the difference. (C) PPI of differentially expressed mRNA genes. (D) The top 30 enriched GO terms of differentially expressed mRNA genes in MH7A cells. (E) The top 30 pathway enrichments of differentially expressed mRNA genes in MH7A cells.

