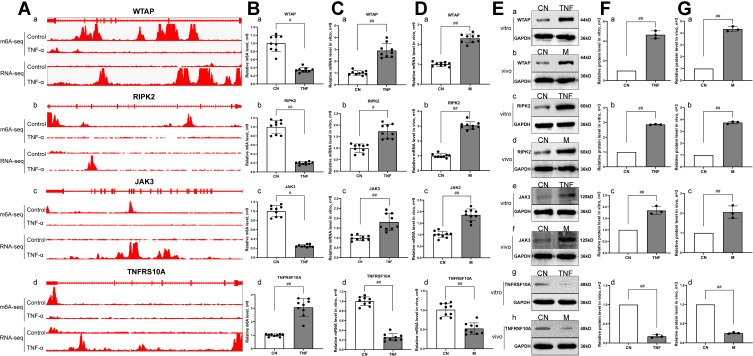
Figure 6.
Correlation analysis, RT-qPCR and Western blot verification of genes with differential m6A modification and differential mRNA expression. (A) Integrative genomics viewer (IGV) plots of m6A methylation abundances and expression abundances in the control group and the TNF-α group. The x-axis represents the genomic position and the y-axis represents the sequence read number. a, the m6A methylation abundances and expression abundances of WTAP. b, the m6A methylation abundances and expression abundances of RIPK2. c, the m6A methylation abundances and expression abundances of JAK3. d, the m6A methylation abundances and expression abundances of TNFRSF10A. (B) The m6A methylation levels were measured by RT-qPCR in the control group and the TNF-α group. a, the m6A methylation level of WTAP. b, the m6A methylation level of RIPK2. c, the m6A methylation level of JAK3. d, the m6A methylation level of TNFRSF10A. (C) The mRNA expression levels in MH7A cells were measured by RT-qPCR. a, the mRNA expression level of WTAP. b, the mRNA expression level of RIPK2. c, the mRNA expression level of JAK3. d, the mRNA expression level of TNFRSF10A. #p < 0.05, ##p < 0.01 compared with the control group. (D) The mRNA expression levels were measured by RT-qPCR in synovial tissues of AA rats. a, the mRNA expression level of WTAP. b, the mRNA expression level of RIPK2. c, the mRNA expression level of JAK3. d, the mRNA expression level of TNFRSF10A. #p < 0.05, ##p < 0.01 compared with the control group. (E) The protein expression levels were measured by Western blot in MH7A cells and synovial tissues of AA rats. a, the protein expression level of WTAP in MH7A cells. b, the protein expression level of WTAP in synovial tissues of AA rats. c, the protein expression level of RIPK2 in MH7A cells. d, the protein expression level of RIPK2 in synovial tissues of AA rats. e, the protein expression level of JAK3 in MH7A cells. f, the protein expression level of JAK3 in synovial tissues of AA rats. g, the protein expression level of TNFRSF10A in MH7A cells. h, the protein expression level of TNFRSF10A in synovial tissues of AA rats. (F), Semiquantitative analysis of protein expression in MH7A cells. a, semiquantitative analysis of WTAP protein. b, semiquantitative analysis of RIPK2 protein. c, semiquantitative analysis of JAK3 protein. d, semiquantitative analysis of TNFRSF10A protein. #p < 0.05, ##p < 0.01 compared with the control group. (G) Semiquantitative analysis of protein expression in synovial tissues of AA rats. a, semiquantitative analysis of WTAP protein. b, semiquantitative analysis of RIPK2 protein. c, semiquantitative analysis of JAK3 protein. d, semiquantitative analysis of TNFRSF10A protein. #p < 0.05, ##p < 0.01 compared with the control group.

