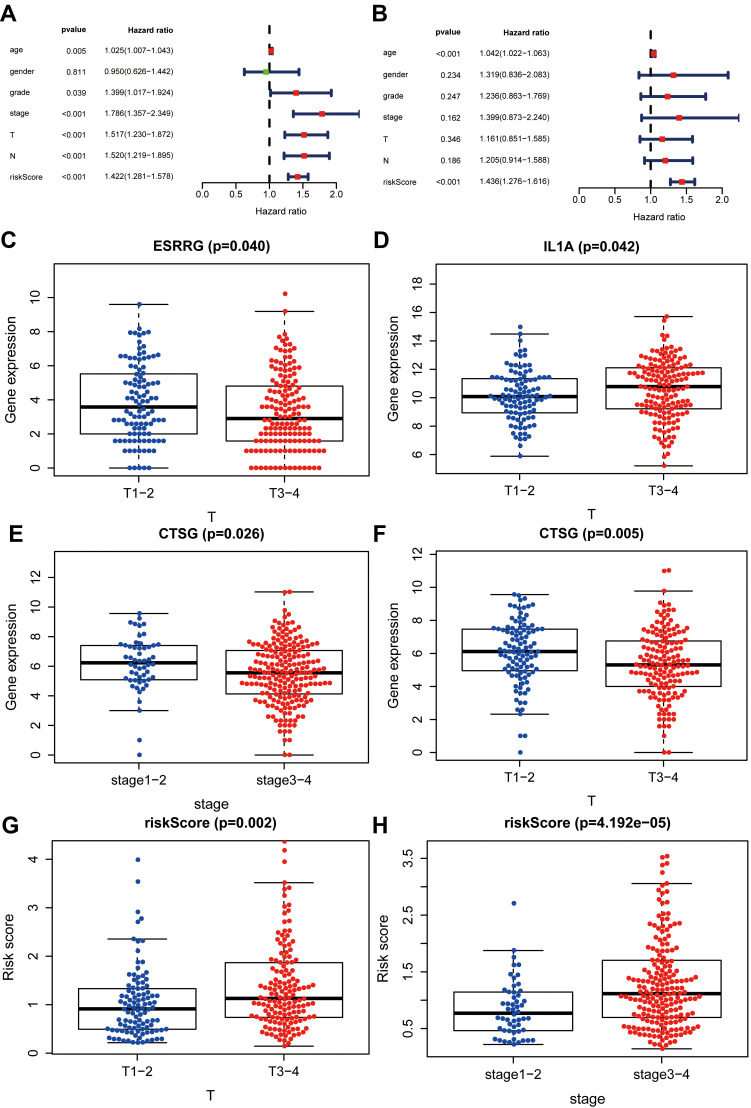
Figure 4.
Correlation analysis between risk score and clinical parameters. (A, B) Bioinformatics indicated that risk score may be an independent prognostic biomarker. (C, D) High-risk score meant high T classification in the TNM system and terminal clinical stage (stage Ⅰ+Ⅱ, stage III+Ⅳ). (E, F) High ESRRG and low IL1A expression level meant low T classification. (G, H) Low CTSG expression level meant high T classification in TNM system and terminal clinical stage.

