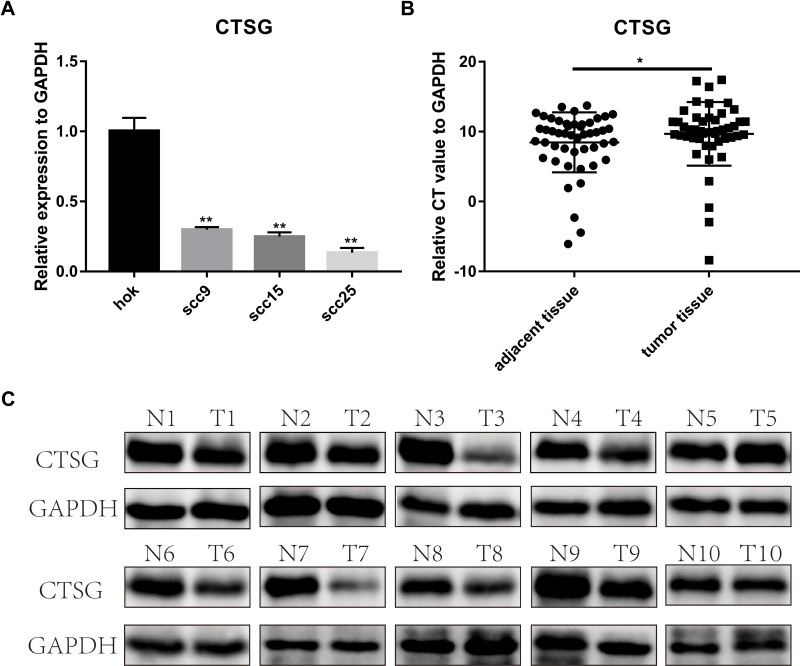
Figure 6.
CTSG was differentially-expressed in OSCC. (A) CTSG was lower expression level in SCC9 (P=0.0021); SCC15 (P=0.0018); SCC25 (P=0.0012). (B) CTSG relative CT value in OSCC specimens and adjacent normal specimens (P=0.0433). The higher the relative CT value, the lower the CTSG expression level. (C) CTSG protein level in 10 OSCC cases. Eight cases were lower protein level in OSCC tumor tissues. N meant adjacent normal control, while T stands for tumor tissues. Significant differences were supposed at *P<0.05; **P<0.01.

