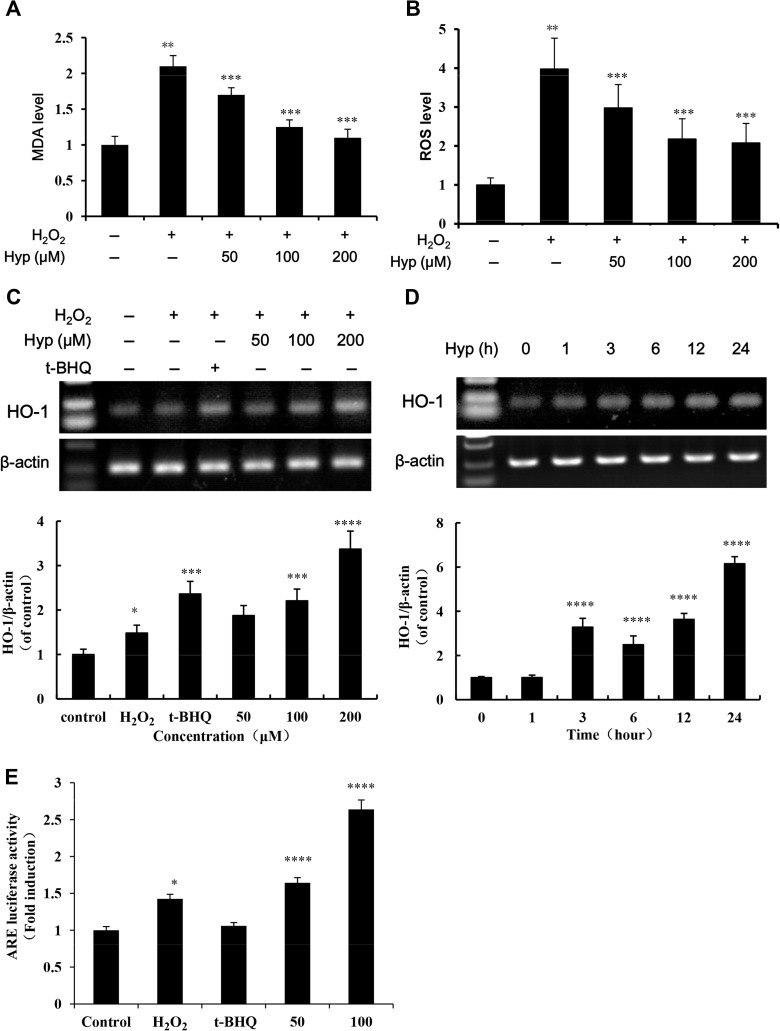
Figure 2.
The effect of Hyp on MDA, ROS and HO-1 levels in the L02 cells induced by H2O2. Liver cells were pretreated with Hyp (50, 100, 200 μM) or tBHQ (50 μM) for 24 h and then treated with or without H2O2 (100 μM) for one hour. Effect of Hyp on MDA (A) and ROS (B) levels in L02 cells treated with H2O2 (n=6); L02 cells were cultured with increasing concentrations of Hyp for 24 h or 200 μM of Hyp for 0–24 h, HO-1 mRNA levels were analyzed by RT-PCR. Dose-effect (C) and time-effect (D) of Hyp on HO-1 expression in L02 cells treated with H2O2; β-actin was used as loading control for each lane. Scanning densitometry was used for semi-quantitative analysis by comparison with control groups (graphs of A and B). (E) Relative luciferase activity was examined by the dual-luciferase reporter assay system. The luciferase activity was normalized against untreated cells with plasmid transfection. *P<0.05, **P<0.01 compared with normal control cells; ***P<0.05, ****P<0.01 compared with H2O2 treated cells.

