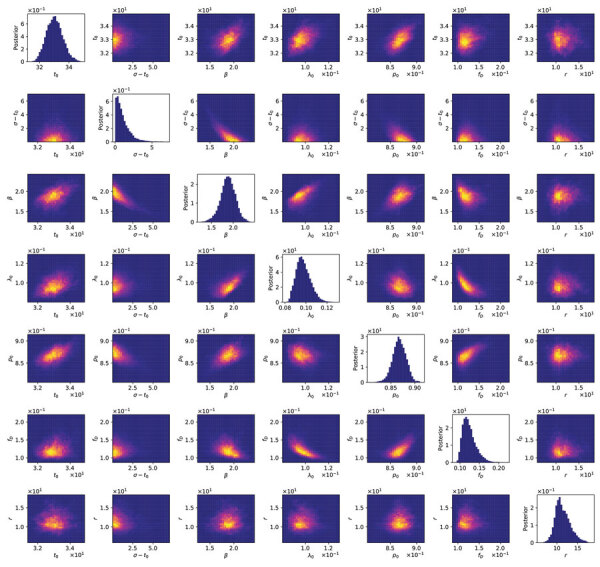
Figure 6.

Matrix of 1- and 2-dimensional projections of the 7-dimensional posterior samples obtained for the adjustable parameters associated with the compartmental model (n = 0) for daily new case counts of coronavirus disease in the New York City, New York, metropolitan statistical area, United States, January 21–June 21, 2020. Plots of marginal posteriors (1-dimensional projections) are shown on the diagonal from top left to bottom right. Other plots are 2-dimensional projections indicating the correlations between parameter estimates. Brightness indicates higher probability density. A compact bright area indicates absence of or relatively low correlation. An extended, asymmetric bright area indicates relatively high correlation.
