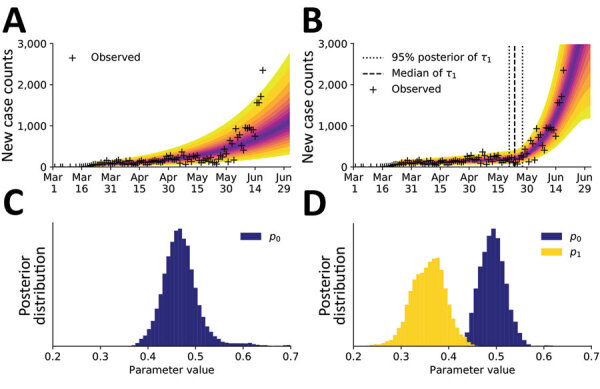
Figure 8.

Predictions of the compartmental model for daily new case counts of coronavirus disease in the Phoenix, Arizona, metropolitan statistical area, United States, January 21–June 18, 2020. A) Model using 1 initial period of social distancing (n = 0). B) Model using an initial period of social distancing and a subsequent period of reduced adherence to social distancing practices (n = 1). C) The marginal posteriors for the social-distancing setpoint parameter p0 inferred in panel A. D) The marginal posteriors for the social-distancing parameters p0 and p1 inferred in panel B.
