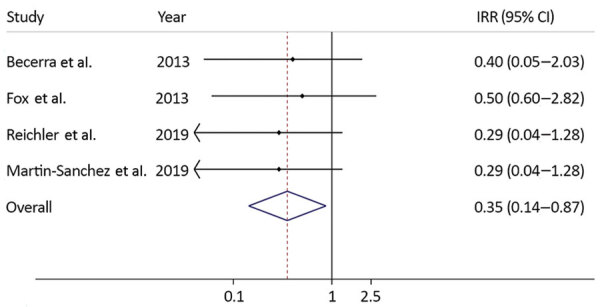
Figure 1.

Incidence rate ratios for effectiveness of preventive therapy using data from published studies and a summary measure in study of preventive therapy for persons exposed at home to drug-resistant tuberculosis, Karachi, Pakistan, February 2016–March 2017. Solid line on y axis indicates null. Dotted line indicates pooled estimate of preventive therapy effectiveness. Blue diamond indicates 95% CI. Small diamonds indicate point estimates of preventive therapy effectiveness using data from each study with its CI. IRR, incident rate ratio.
