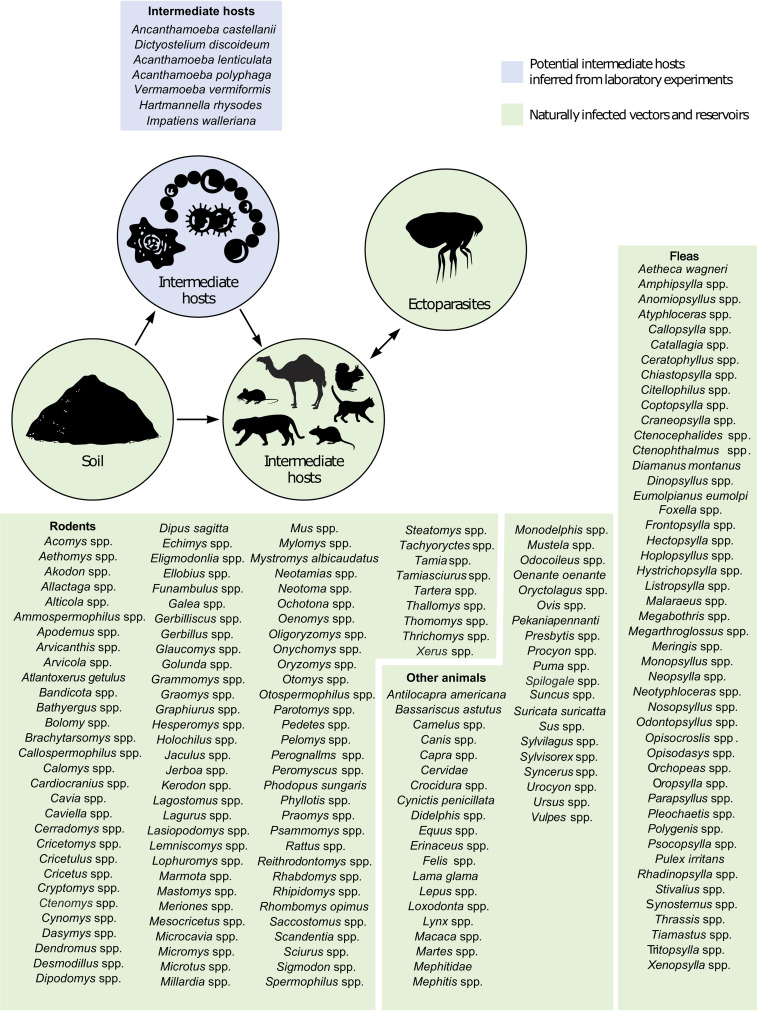
FIG 3.
Scheme of the natural epidemiology of plague representing all documented natural and animal reservoirs, intermediate reservoirs, sources of infection, and vectors for humans described in the literature. Green represents field isolation and laboratory-confirmed sources. Blue represents potential sources/reservoirs inferred from laboratory experiments.

